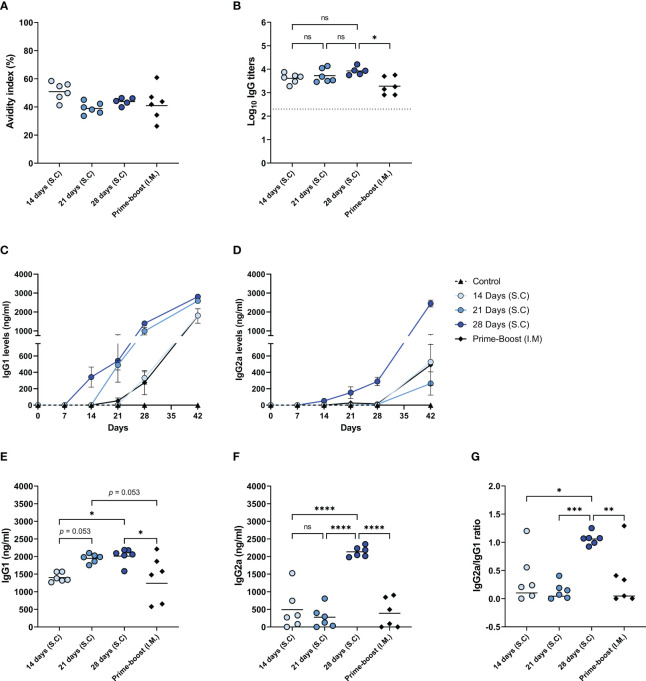
Figure 5.
Quality of the induced antibody immune response. The quality of the induced humoral immune response in mice, as described in Figure 1 , was assessed by determining the avidity index (A), the high avidity antibody titer (B), the levels of IgG1 (C) and IgG2a (D) subclasses over the course of the experiment, endpoint IgG1 (E) and IgG2a (F) levels, and the IgG2a/IgG1 ratio (G). Statistical comparisons between experimental groups were done using one-way ANOVA with Tukey post-hoc test (* p < 0.05, ** p < 0.01, *** p < 0.001, **** p < 0.0001). The dotted line represents the detection limit. ns, not significantly different.

