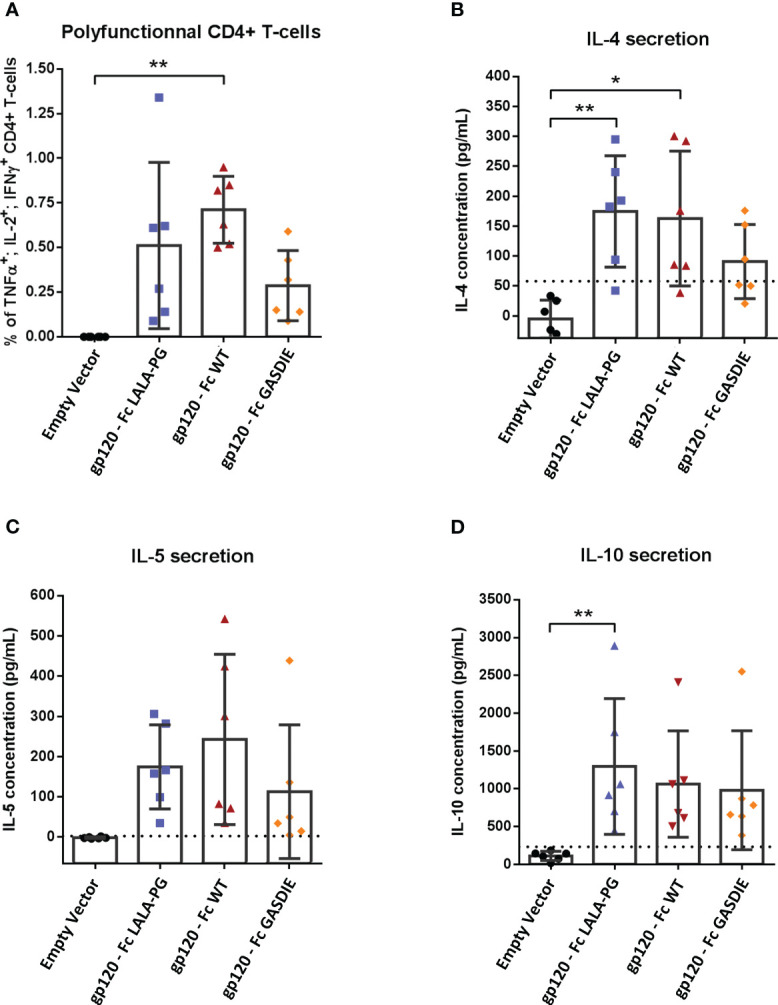
Figure 6.

Gp120-specific T-helper cell responses to gp120 – Fc fusions proteins. (A) Splenocytes from immunized mice at week 5 were isolated and stimulated for 6h with an HIV Env MHC-II restricted peptide in presence of Brefaldin A and a CD28 antibody. CD4+ T-cells expressing TNFα, IL-2 and IFNγ were analyzed by FACS following an intracellular cytokine staining. (B–D) Splenocytes were stimulated with an HIV Env MHC-II restricted peptide in presence of CD28 antibody for 48h. Cell supernatants were harvested, diluted 1:3 and IL-4 (B), IL-5 (C) and IL-10 (D) concentrations were determined by quantitative ELISAs. The cut-off value is indicated by the dotted line on each graph. Bars represent mean and SD of each group overlaid with individual data points (n=6 per group). Significant differences as determined by One-Way ANOVA followed by Tukey’s multiple comparison test are indicated (* p<0.05; ** p<0.005).
