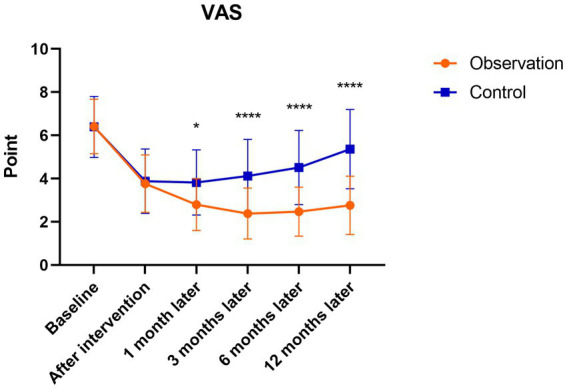
Figure 7.

Mean VAS scores in the observation and control groups during the 12-month follow-up period. *There was a statistically significant difference between the treatment groups at 1 month after intervention (p < 0.05), ****From 3 to 12 months after intervention, there were significant differences between the treatment groups (p < 0.0001).
