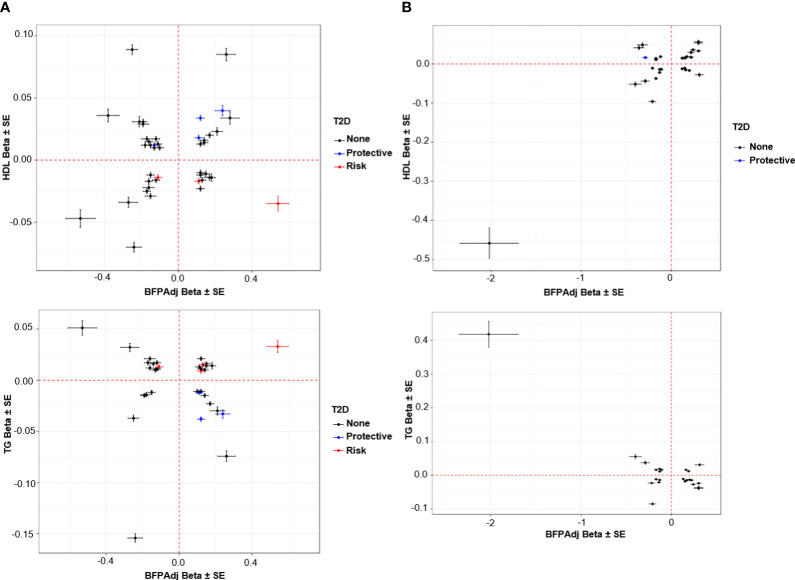
Figure 5.
Association of SNPs with HDL and TG vs. BFPAdj. (A) Males, (B) Female. The plots show the effect (β ± SE) of BFPAdj GWAS SNPs on BFPAdj vs. HDL (top) and TG (bottom) (23). Only SNPs associated with both BFPAdj and HDL or TG at GWS are included in the plots. The SNPs with risk and protective effect on T2D (both sexes combined) at GWS level are shown in red and blue, respectively (21). The rest of SNPs are shown in black.

