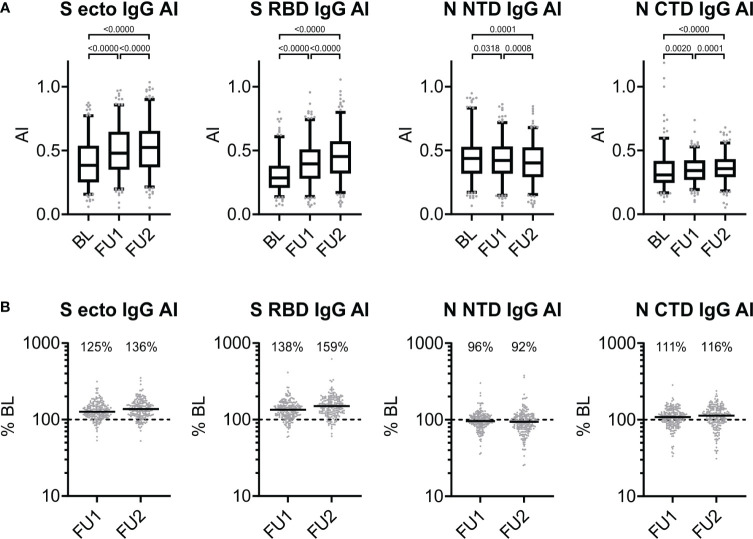
Figure 3.
Antigen-specific changes of avidity over time. (A) Avidity index (AI) of serum IgG directed against S ecto, S RBD, N NTD, and N CTD observed at baseline, first and second follow-up visit 5 and 10 months after baseline (BL, FU1 and FU2, respectively): for each of the three time points, we show the distribution of values (box: 1st quartile, median and 3rd quartile; whiskers 5th and 95th percentile; dots below and above the whiskers refer to observed values outside the 5th and 95th percentile) and p-values from Wilcoxon signed-rank test. (B) Proportional changes in the AI at first or second follow-up (FU1, FU2) compared to BL (in percent). For each of the three time points, we show individual changes in avidity at FU1 and FU2 compared to BL (% BL). The dashed line represents the 100% BL level (i.e. no change), horizontal solid lines show the median values, and the median change is stated as % for each follow-up time point compared to BL.

