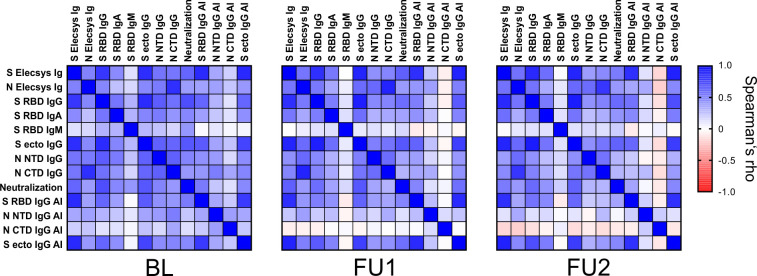
Figure 4.
Correlation of the different serological parameters at the three visits. Spearman’s rho values of pairwise comparisons between the test results are plotted for the three visits BL, FU1 and FU2. A color map for the gradient of values is given on the right, ranging from Spearman’s rho values from –1 to 1. (Spearman’s rho values and corresponding p-values are given in Supplementary Table 2).

