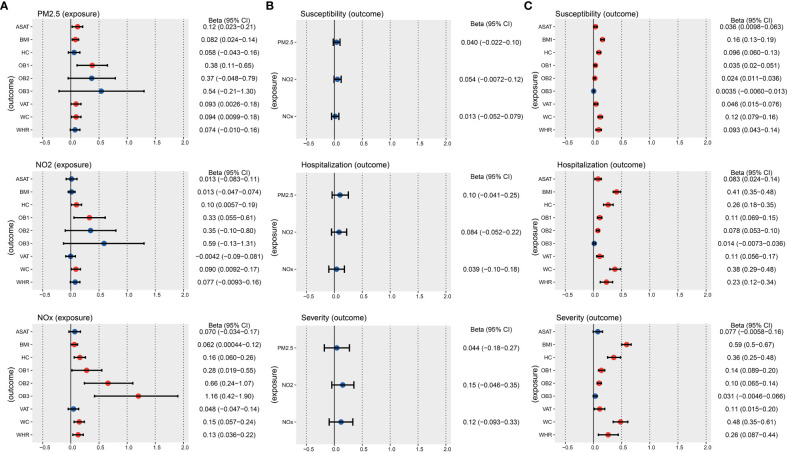
Figure 2.
IVW results of the causal relationship between air pollution, obesity, and COVID-19 risk. (A) IVW results of the causal relationship between air pollution and obesity. (B) IVW results of the causal relationship between air pollution and COVID-19. (C) IVW results of the causal relationship between obesity and COVID-19. The red color means the p-value is less than 0.05.

