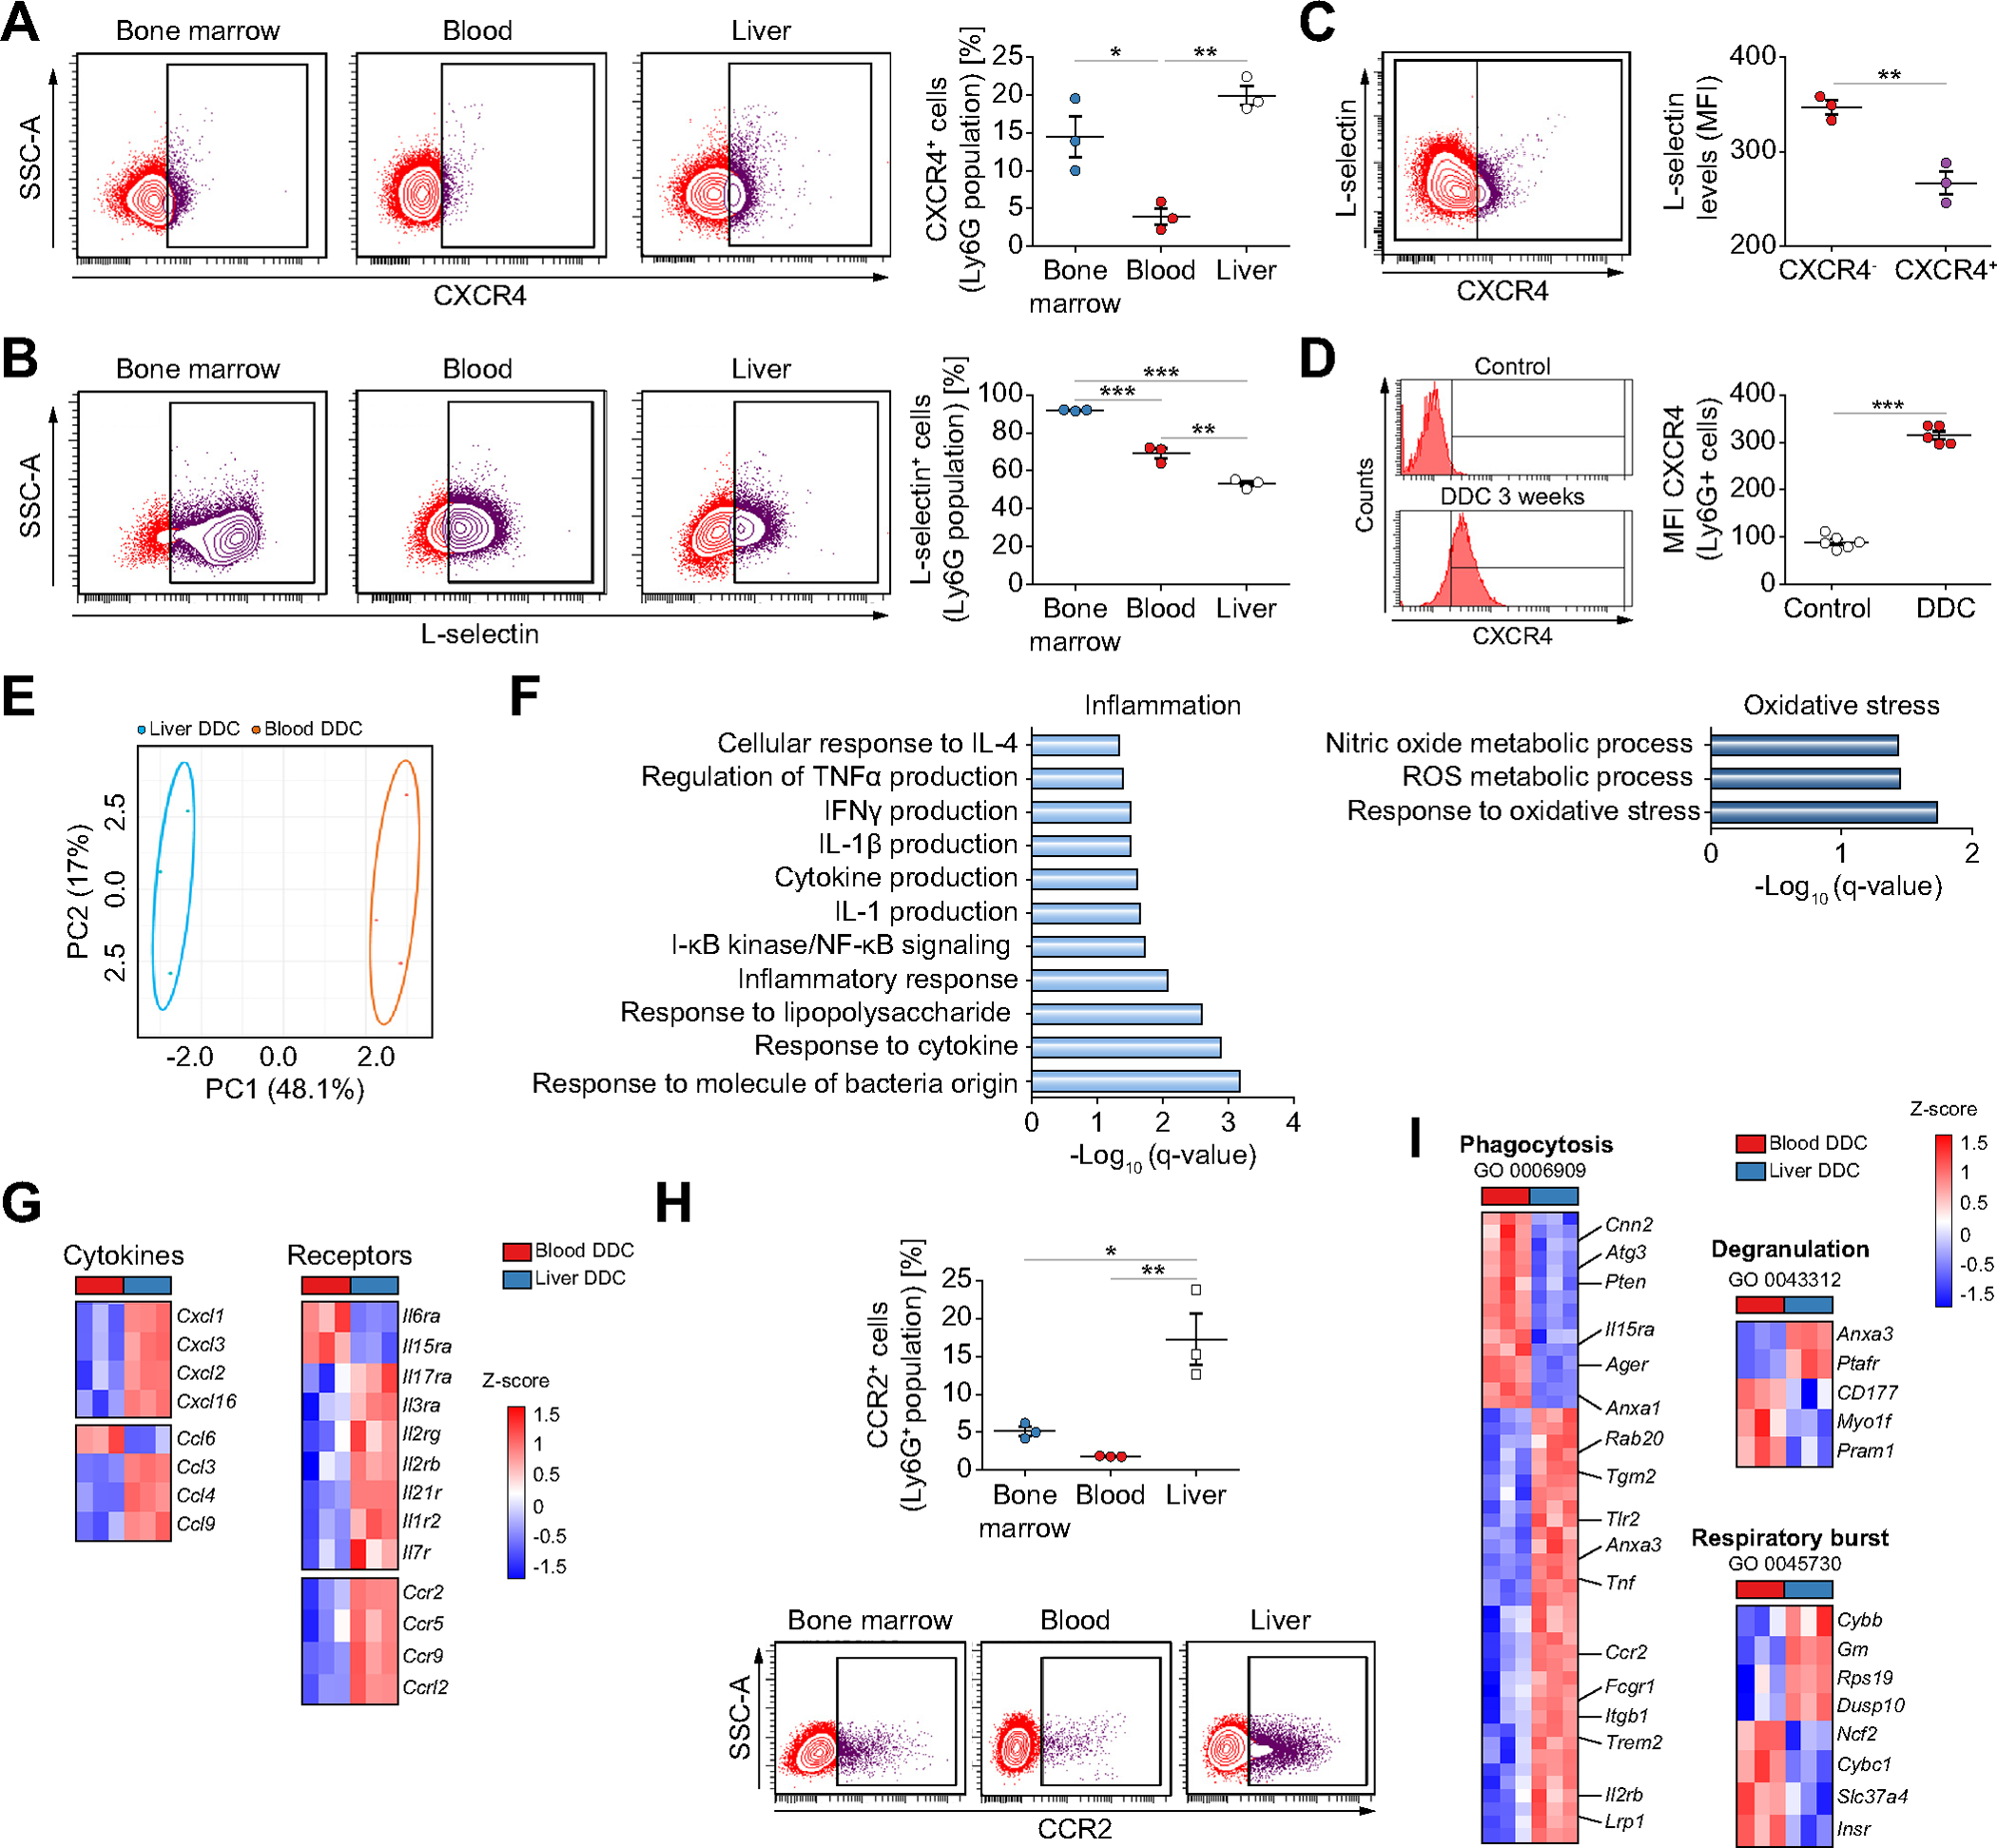
Fig. 3. Liver neutrophils in chronic liver damage acquire an aged and pro-inflammatory phenotype.

Flow cytometry analysis of the expression of CXCR4 (A) and L-selectin (B) in Ly6G+ cells (n = 3 mice per group). (C) Flow cytometry analysis of DDC-treated liver neutrophils (n = 3 mice per group). (D) Flow cytometry analysis of liver neutrophils (n = 5 mice per group). (E) Principal component analysis of transcriptomic data of neutrophils from DDC-treated mice (n = 3 mice per group). (F) Enriched gene ontology biological processes in liver neutrophils compared to blood neutrophils. (G) Heat map of differentially expressed inflammatory cytokines and receptors (n = 3 mice per group). (H) Flow cytometry analysis of CCR2 expression in Ly6G+ neutrophils in DDC-fed mice (n = 3 mice per group). (I) Heat map of differentially expressed genes associated with significantly enriched gene ontology annotations (n = 3 mice per group). All data is presented as mean ± SEM. *p <0.05, **p <0.01 and ***p <0.001 as determined by one-way ANOVA with Tukey’s multiple comparison test (A, B, H) and Student’s t test (C, D). CCR2, C-C Motif Chemokine Receptor 2; CXCR4, C-X-C motif chemokine receptor 4; DDC, 3,5-diethoxycarbonyl-1,4-dihydrocollidine; Ly6G, lymphocyte antigen 6 complex locus G6D; MFI, median fluorescence intensity.
