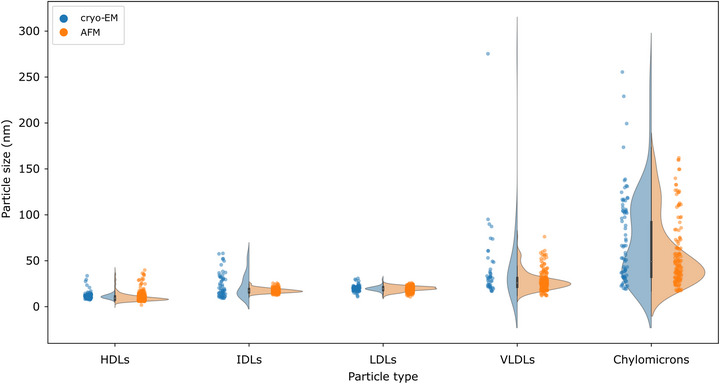
FIGURE 2.

Comparison of size distributions obtained from cryo‐EM image analysis (blue dots and frequency plots) and D eq distributions calculated from AFM morphometry (orange dots and frequency plots). The two methods largely agree on the modes of all distributions.
