FIGURE 3.

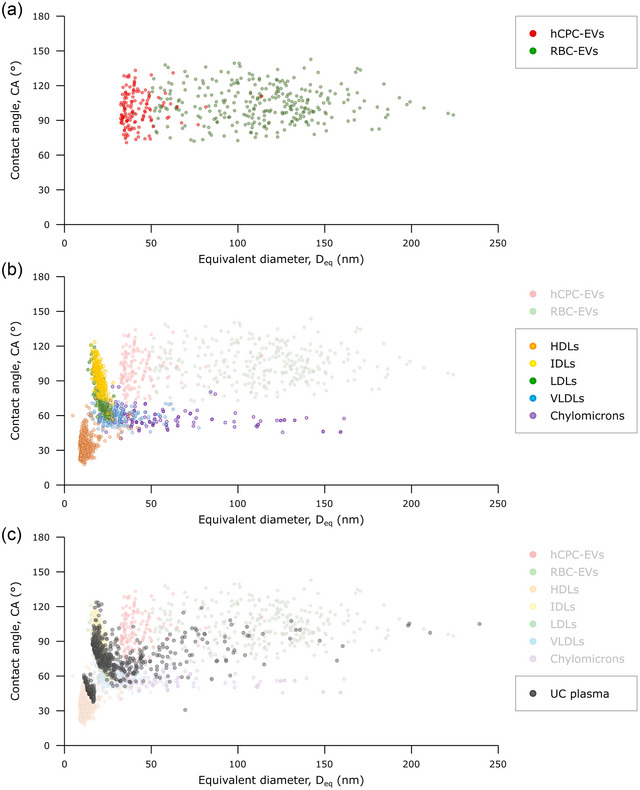
(a) CA/Deq plot of isolated hCPC‐EVs (red) and RBC‐EVs (green). As expected for objects displaying the nanomechanical behaviour of pressurised elastic vessels, the vast majority of EVs display a range of CAs (75°–135°) which does not change as a function of D eq. In other words, intact EVs have a conserved stiffness which is relatively constant in the small size range associated with EVs.
(b) CA/D eq plot of each sample in the purified LP series: HDL (orange), IDL (yellow), LDL (green), VLDL (light blue), Chylomicrons (purple). Clusters of individual EVs from panel (a) are superimposed in semi‐transparency for the sake of comparison. Each LP subclass populates a different cluster with marginal overlap; no LP subtype populates the zone previously associated with EVs. Chylomicrons and VLDLs are characterised by a conserved average CA value, making their nanomechanical behaviour similar to that of EVs but with lower stiffness. Smaller LPs evidence different (and currently unknown) mechanical behaviours. (c) CA/D eq plot of an ultracentrifuged plasma sample (black dots), putatively containing a mixture of LPs and EVs as suggested by its comparison with plots (a) and (b), which are superimposed in semi‐transparency. The plot contains the AFM morphometrical measurements of several hundred individual objects found within the plasma sample, making it possible to estimate the presence of specific LP classes, EVs, and their relative abundance (see Figure S5).
