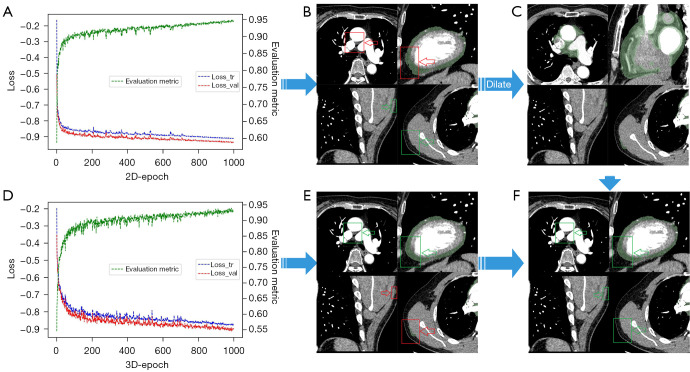
Figure 3.
The fused results of the 2D and 3D models. (A) The 2D and (D) 3D model training loss curves. The 3 curves in the figure are the training (blue), validation loss (red), and results of the evaluation (green). The segmentation results of the (B) 2D and (E) 3D models. (C) The process of dilating the 2D model segmentation results. (F) The results of the fusion model. The red box represents the missegmentation, and the green box represents the correct segmentation.

