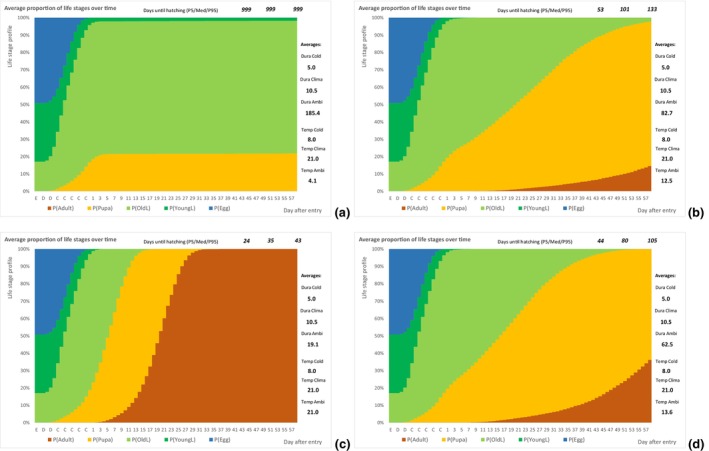
Figure A.11.

Average proportion of different life stages (blue = eggs, dark green = L1–L2, light green = L3–L5, yellow = pupae, red = adults) of Thaumatotibia leucotreta by day (horizontal axis) starting with entering the EU (E), distribution in cooled conditions (D), consumption in climatised environment (C) and days after wasting by the consumer. Results by the developmental model are given for NUTS2 regions in climate suitability class 1 for winter (a), spring (b), summer (c) and autumn (d)
