
Figure 1.
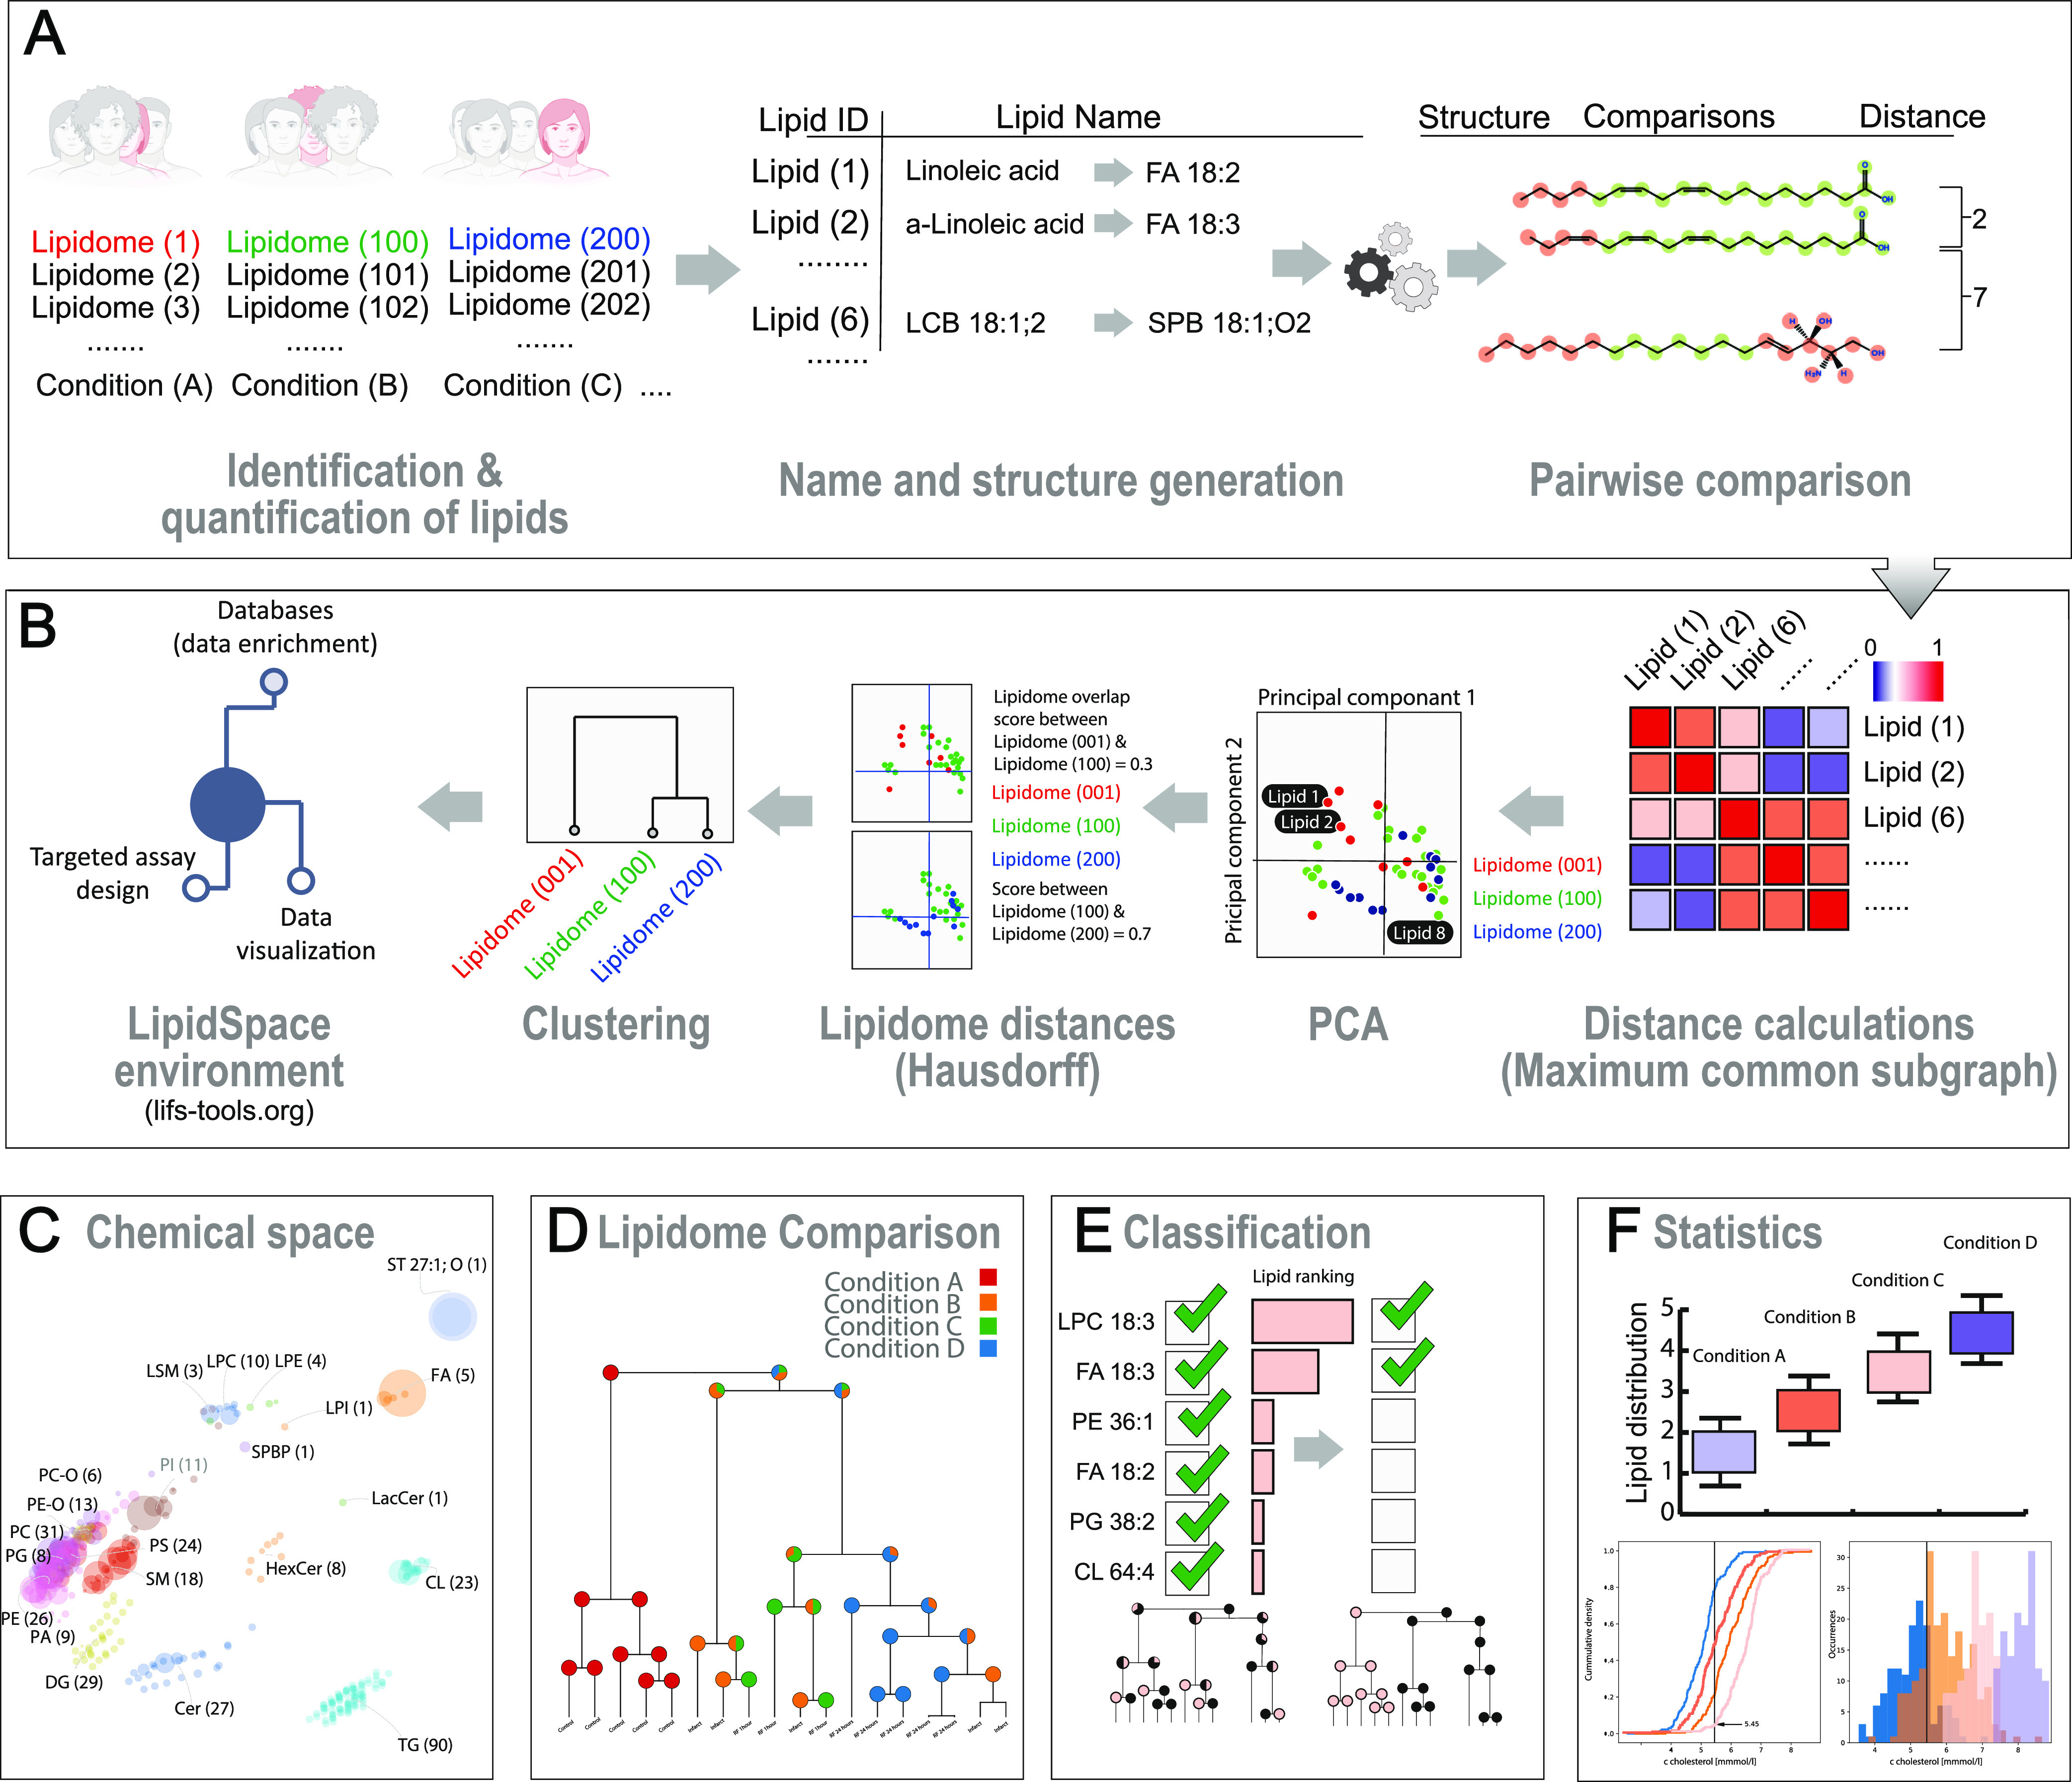
Comparative lipidome analysis and reanalysis with LipidSpace. (A) Qualitative or quantitative lipidomics data are parsed and translated to the standard shorthand nomenclature; each lipid is transformed into a chemical graph structure. (B) By applying maximum common subgraph calculations, distances are calculated between lipids. The lipidomes are visualized using principal component analysis. Determining Hausdorff distances allows a global clustering and the visualization of lipidome similarity. A rapid examination is applicable by excluding lipids, lipid classes, samples, or filtering study variables. (C) Visualizing all lipidomes within a study offers a quick grasp of the data. (D) Lipidome clustering dendrogram, including information about the study variables. (E) Classification of lipids responsible for separating lipidomes with respect to a given study variable. (F) Statistical evaluation of quantitative lipid differences across lipidomes.