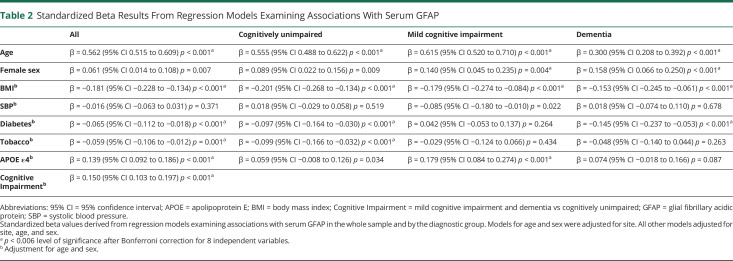
Table 2.
Standardized Beta Results From Regression Models Examining Associations With Serum GFAP
| All | Cognitively unimpaired | Mild cognitive impairment | Dementia | |
| Age | β = 0.562 (95% CI 0.515 to 0.609) p < 0.001a | β = 0.555 (95% CI 0.488 to 0.622) p < 0.001a | β = 0.615 (95% CI 0.520 to 0.710) p < 0.001a | β = 0.300 (95% CI 0.208 to 0.392) p < 0.001a |
| Female sex | β = 0.061 (95% CI 0.014 to 0.108) p = 0.007 | β = 0.089 (95% CI 0.022 to 0.156) p = 0.009 | β = 0.140 (95% CI 0.045 to 0.235) p = 0.004a | β = 0.158 (95% CI 0.066 to 0.250) p < 0.001a |
| BMIb | β = −0.181 (95% CI −0.228 to −0.134) p < 0.001a | β = −0.201 (95% CI −0.268 to −0.134) p < 0.001a | β = −0.179 (95% CI −0.274 to −0.084) p < 0.001a | β = −0.153 (95% CI −0.245 to −0.061) p < 0.001a |
| SBPb | β = −0.016 (95% CI −0.063 to 0.031) p = 0.371 | β = 0.018 (95% CI −0.029 to 0.058) p = 0.519 | β = −0.085 (95% CI −0.180 to −0.010) p = 0.022 | β = 0.018 (95% CI −0.074 to 0.110) p = 0.678 |
| Diabetesb | β = −0.065 (95% CI −0.112 to −0.018) p < 0.001a | β = −0.097 (95% CI −0.164 to −0.030) p < 0.001a | β = 0.042 (95% CI −0.053 to 0.137) p = 0.264 | β = −0.145 (95% CI −0.237 to −0.053) p < 0.001a |
| Tobaccob | β = −0.059 (95% CI −0.106 to −0.012) p = 0.001a | β = −0.099 (95% CI −0.166 to −0.032) p < 0.001a | β = −0.029 (95% CI −0.124 to 0.066) p = 0.434 | β = −0.048 (95% CI −0.140 to 0.044) p = 0.263 |
| APOE ε4b | β = 0.139 (95% CI 0.092 to 0.186) p < 0.001a | β = 0.059 (95% CI −0.008 to 0.126) p = 0.034 | β = 0.179 (95% CI 0.084 to 0.274) p < 0.001a | β = 0.074 (95% CI −0.018 to 0.166) p = 0.087 |
| Cognitive Impairmentb | β = 0.150 (95% CI 0.103 to 0.197) p < 0.001a |
Abbreviations: 95% CI = 95% confidence interval; APOE = apolipoprotein E; BMI = body mass index; Cognitive Impairment = mild cognitive impairment and dementia vs cognitively unimpaired; GFAP = glial fibrillary acidic protein; SBP = systolic blood pressure.
Standardized beta values derived from regression models examining associations with serum GFAP in the whole sample and by the diagnostic group. Models for age and sex were adjusted for site. All other models adjusted for site, age, and sex.
p < 0.006 level of significance after Bonferroni correction for 8 independent variables.
Adjustment for age and sex.

