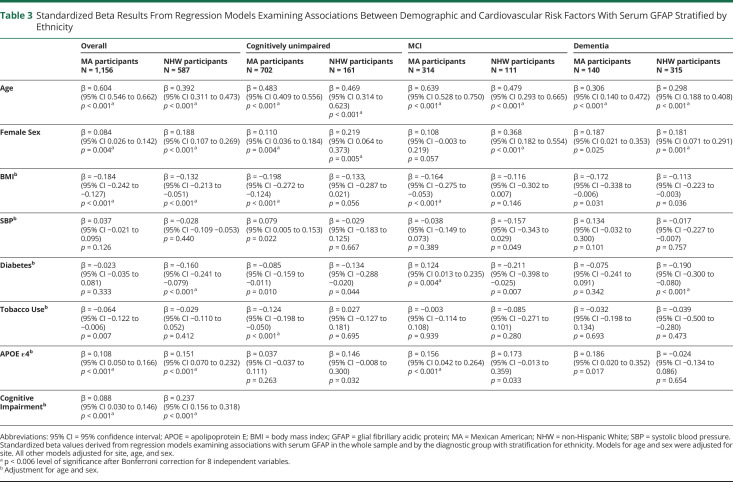
Table 3.
Standardized Beta Results From Regression Models Examining Associations Between Demographic and Cardiovascular Risk Factors With Serum GFAP Stratified by Ethnicity
| Overall | Cognitively unimpaired | MCI | Dementia | |||||
| MA participants N = 1,156 |
NHW participants N = 587 |
MA participants N = 702 |
NHW participants N = 161 | MA participants N = 314 |
NHW participants N = 111 | MA participants N = 140 |
NHW participants N = 315 |
|
| Age | β = 0.604 (95% CI 0.546 to 0.662) p < 0.001a | β = 0.392 (95% CI 0.311 to 0.473) p < 0.001a | β = 0.483 (95% CI 0.409 to 0.556) p < 0.001a | β = 0.469 (95% CI 0.314 to 0.623) p < 0.001a | β = 0.639 (95% CI 0.528 to 0.750) p < 0.001a | β = 0.479 (95% CI 0.293 to 0.665) p < 0.001a | β = 0.306 (95% CI 0.140 to 0.472) p < 0.001a | β = 0.298 (95% CI 0.188 to 0.408) p < 0.001a |
| Female Sex | β = 0.084 (95% CI 0.026 to 0.142) p = 0.004a | β = 0.188 (95% CI 0.107 to 0.269) p < 0.001a | β = 0.110 (95% CI 0.036 to 0.184) p = 0.004a | β = 0.219 (95% CI 0.064 to 0.373) p = 0.005a | β = 0.108 (95% CI −0.003 to 0.219) p = 0.057 | β = 0.368 (95% CI 0.182 to 0.554) p < 0.001a | β = 0.187 (95% CI 0.021 to 0.353) p = 0.025 | β = 0.181 (95% CI 0.071 to 0.291) p = 0.001a |
| BMIb | β = −0.184 (95% CI −0.242 to −0.127) p < 0.001a | β = −0.132 (95% CI −0.213 to −0.051) p < 0.001a | β = −0.198 (95% CI −0.272 to −0.124) p < 0.001a | β = −0.133, (95% CI −0.287 to 0.021) p = 0.056 | β = −0.164 (95% CI −0.275 to −0.053) p < 0.001a | β = −0.116 (95% CI −0.302 to 0.007) p = 0.146 | β = −0.172 (95% CI −0.338 to −0.006) p = 0.031 | β = −0.113 (95% CI −0.223 to −0.003) p = 0.036 |
| SBPb | β = 0.037 (95% CI −0.021 to 0.095) p = 0.126 | β = −0.028 (95% CI −0.109 −0.053) p = 0.440 | β = 0.079 (95% CI 0.005 to 0.153) p = 0.022 | β = −0.029 (95% CI −0.183 to 0.125) p = 0.667 | β = −0.038 (95% CI −0.149 to 0.073) p = 0.389 | β = −0.157 (95% CI −0.343 to 0.029) p = 0.049 | β = 0.134 (95% CI −0.032 to 0.300) p = 0.101 | β = −0.017 (95% CI −0.227 to −0.007) p = 0.757 |
| Diabetesb | β = −0.023 (95% CI −0.035 to 0.081) p = 0.333 | β = −0.160 (95% CI −0.241 to −0.079) p < 0.001a | β = −0.085 (95% CI −0.159 to −0.011) p = 0.010 | β = −0.134 (95% CI −0.288 −0.020) p = 0.044 | β = 0.124 (95% CI 0.013 to 0.235) p = 0.004a | β = −0.211 (95% CI −0.398 to −0.025) p = 0.007 | β = −0.075 (95% CI −0.241 to 0.091) p = 0.342 | β = −0.190 (95% CI −0.300 to −0.080) p < 0.001a |
| Tobacco Useb | β = −0.064 (95% CI −0.122 to −0.006) p = 0.007 | β = −0.029 (95% CI −0.110 to 0.052) p = 0.412 | β = −0.124 (95% CI −0.198 to −0.050) p < 0.001a | β = 0.027 (95% CI −0.127 to 0.181) p = 0.695 | β = −0.003 (95% CI −0.114 to 0.108) p = 0.939 | β = −0.085 (95% CI −0.271 to 0.101) p = 0.280 | β = −0.032 (95% CI −0.198 to 0.134) p = 0.693 | β = −0.039 (95% CI −0.500 to −0.280) p = 0.473 |
| APOE ε4b | β = 0.108 (95% CI 0.050 to 0.166) p < 0.001a | β = 0.151 (95% CI 0.070 to 0.232) p < 0.001a | β = 0.037 (95% CI −0.037 to 0.111) p = 0.263 | β = 0.146 (95% CI −0.008 to 0.300) p = 0.032 | β = 0.156 (95% CI 0.042 to 0.264) p < 0.001a | β = 0.173 (95% CI −0.013 to 0.359) p = 0.033 | β = 0.186 (95% CI 0.020 to 0.352) p = 0.017 | β = −0.024 (95% CI −0.134 to 0.086) p = 0.654 |
| Cognitive Impairmentb | β = 0.088 (95% CI 0.030 to 0.146) p < 0.001a | β = 0.237 (95% CI 0.156 to 0.318) p < 0.001a | ||||||
Abbreviations: 95% CI = 95% confidence interval; APOE = apolipoprotein E; BMI = body mass index; GFAP = glial fibrillary acidic protein; MA = Mexican American; NHW = non-Hispanic White; SBP = systolic blood pressure.
Standardized beta values derived from regression models examining associations with serum GFAP in the whole sample and by the diagnostic group with stratification for ethnicity. Models for age and sex were adjusted for site. All other models adjusted for site, age, and sex.
p < 0.006 level of significance after Bonferroni correction for 8 independent variables.
Adjustment for age and sex.

