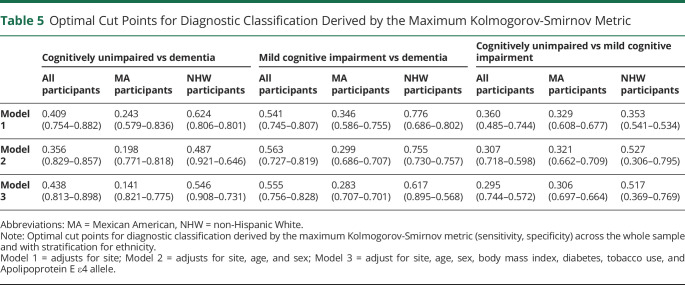
Table 5.
Optimal Cut Points for Diagnostic Classification Derived by the Maximum Kolmogorov-Smirnov Metric
| Cognitively unimpaired vs dementia | Mild cognitive impairment vs dementia | Cognitively unimpaired vs mild cognitive impairment | |||||||
| All participants | MA participants | NHW participants | All participants | MA participants | NHW participants | All participants | MA participants | NHW participants | |
| Model 1 | 0.409 (0.754–0.882) | 0.243 (0.579–0.836) | 0.624 (0.806–0.801) | 0.541 (0.745–0.807) | 0.346 (0.586–0.755) | 0.776 (0.686–0.802) | 0.360 (0.485–0.744) | 0.329 (0.608–0.677) | 0.353 (0.541–0.534) |
| Model 2 | 0.356 (0.829–0.857) | 0.198 (0.771–0.818) | 0.487 (0.921–0.646) | 0.563 (0.727–0.819) | 0.299 (0.686–0.707) | 0.755 (0.730–0.757) | 0.307 (0.718–0.598) | 0.321 (0.662–0.709) | 0.527 (0.306–0.795) |
| Model 3 | 0.438 (0.813–0.898) | 0.141 (0.821–0.775) | 0.546 (0.908–0.731) | 0.555 (0.756–0.828) | 0.283 (0.707–0.701) | 0.617 (0.895–0.568) | 0.295 (0.744–0.572) | 0.306 (0.697–0.664) | 0.517 (0.369–0.769) |
Abbreviations: MA = Mexican American, NHW = non-Hispanic White.
Note: Optimal cut points for diagnostic classification derived by the maximum Kolmogorov-Smirnov metric (sensitivity, specificity) across the whole sample and with stratification for ethnicity.
Model 1 = adjusts for site; Model 2 = adjusts for site, age, and sex; Model 3 = adjust for site, age, sex, body mass index, diabetes, tobacco use, and Apolipoprotein E ε4 allele.

