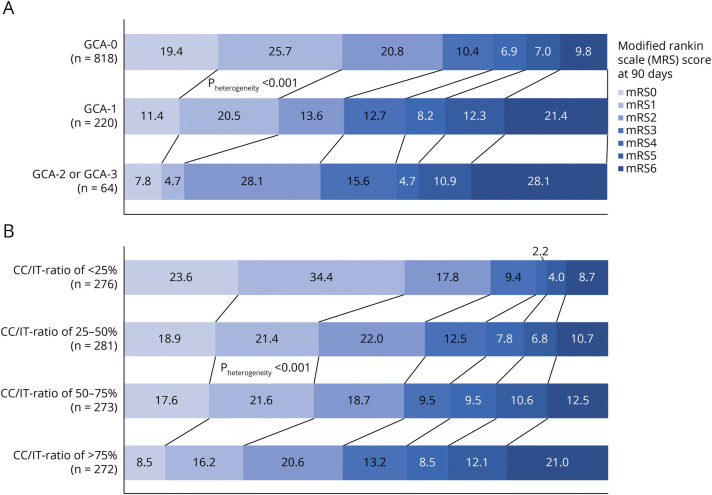
Figure 2. Distribution of 90-Day mRS for Each Category of (A) Global Cortical Atrophy (GCA-Scale) and (B) Subcortical Atrophy (CC/IT-Ratio).
Numbers in bars represent percentages. p Values are derived from unadjusted ordinal regression model (CC/IT-ratio included as a full continuous variable). Abbreviations: CC/IT-ratio = intercaudate-distance-to-inner-table-width ratio; GCA = global cortical atrophy; mRS = modified Rankin Scale.

