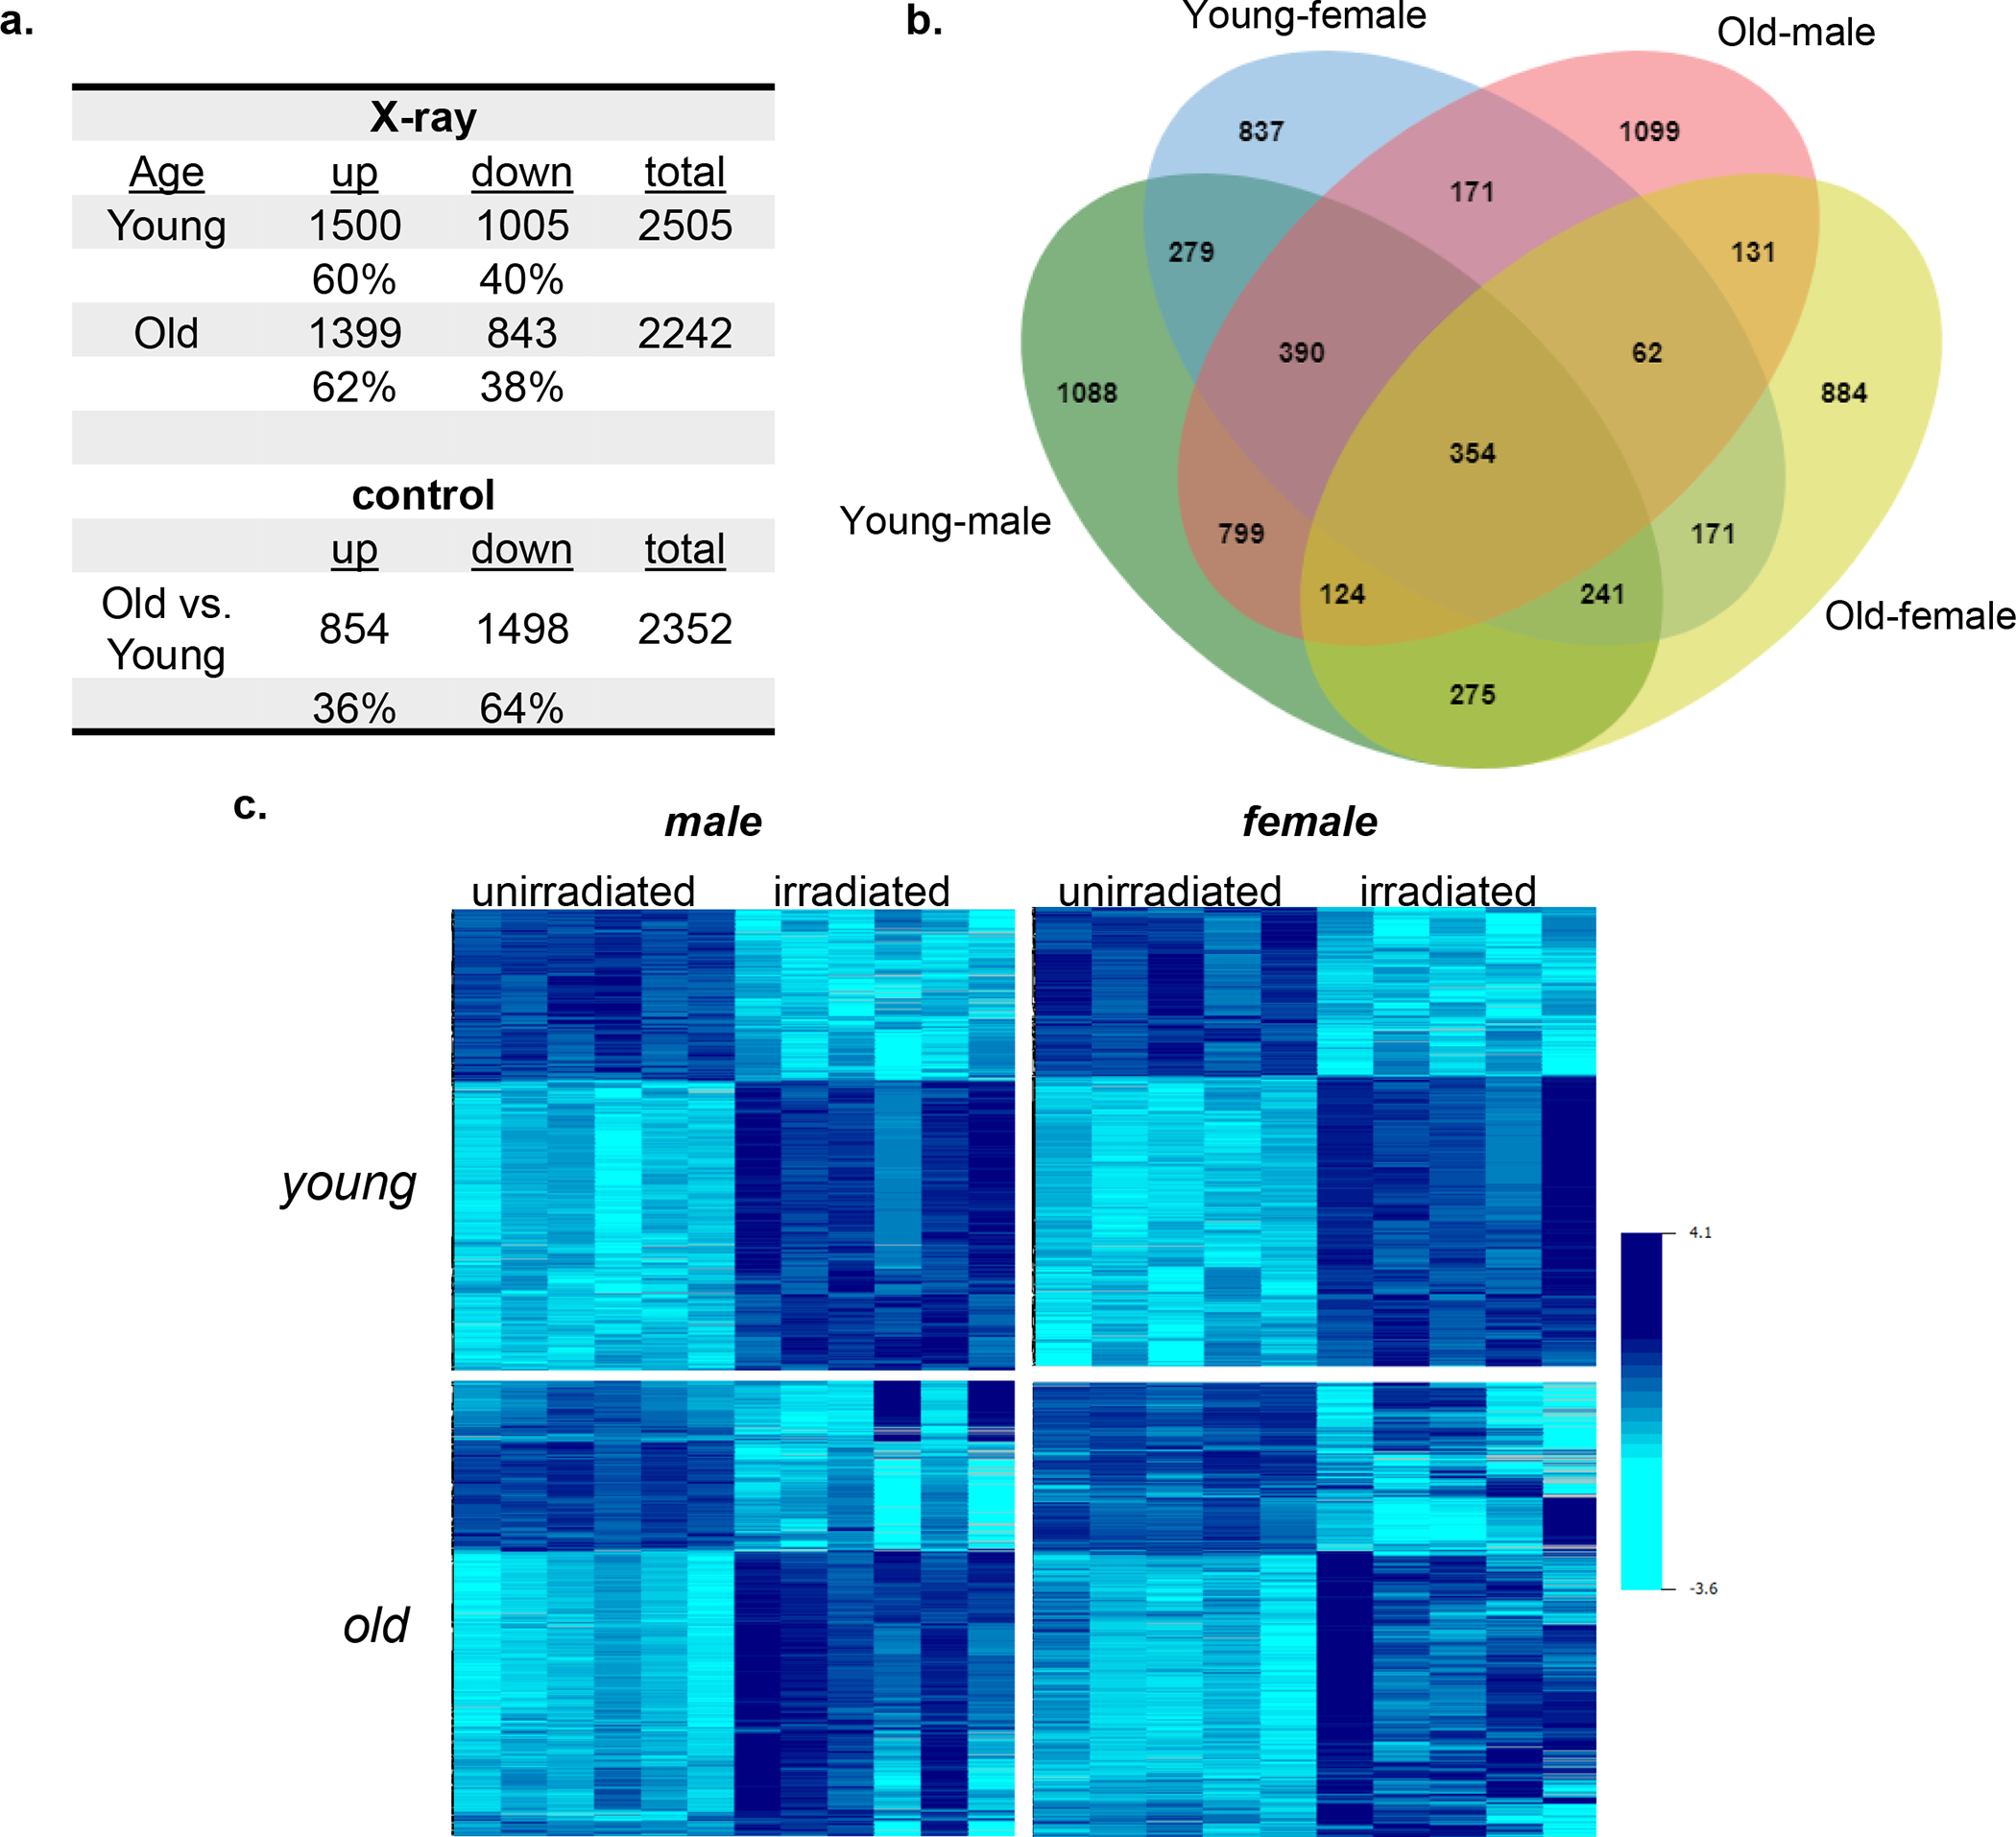
Fig. 2.

Differentially expressed genes. (a) Significantly differentially expressed genes in young and old female mouse blood (p < 0.005) following 4 Gy X-rays (X-ray) relative to unirradiated mice and comparing unirradiated old versus unirradiated young female mice (control). Percent of upregulated (up) and downregulated (down) genes are shown. (b) Venn diagram showing overlap of differentially expressed genes in irradiated young male (green) and female (blue) versus irradiated old male (red) and female (yellow) mice (c) Heatmaps of combined effects of age and sex on commonly differentially expressed genes in young female and young male mice exposed to radiation.
