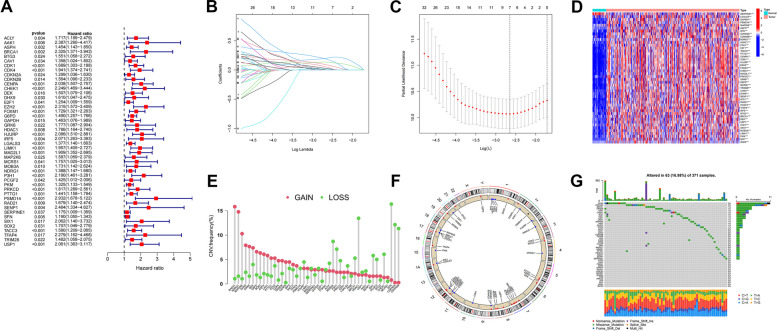
Fig. 3.
Prognostic characterization of differential genes in cellular senescence. Forest plots, 46 cellular senescence-associated genes associated with HCC prognosis. A (LASSO) Cox regression analysis to identify 46 associated senescence differential genes. B, C Heat map of 46 associated differential senescence-associated genes in cancer and normal tissues of HCC patients. D The Bar graph shows the frequency of copy number changes and the Circos plot shows the location of senescence genes in the chromosome, Where red dots indicate gene amplification, blue dots indicate gene deletion, and black dots indicate no significant change. E, F waterfall plots to show the somatic mutation rate of 46 senescence genes with a mutation frequency of 16.98% G

