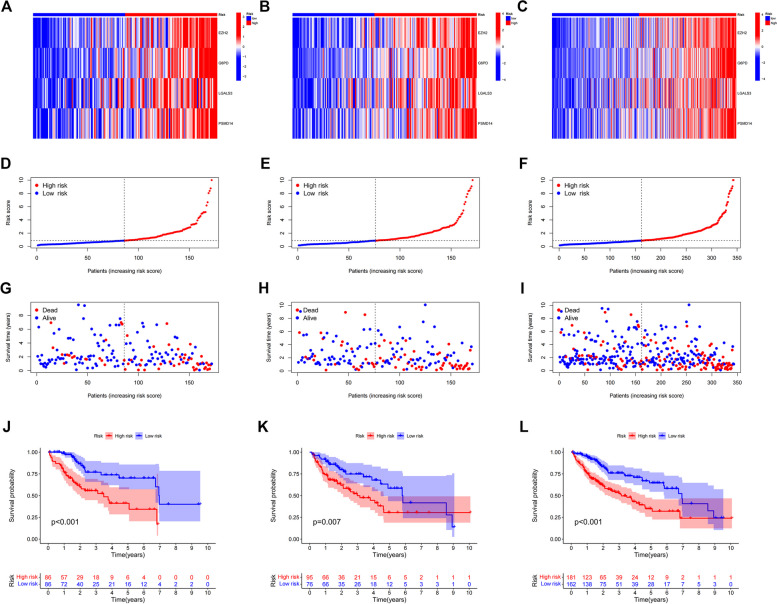
Fig. 4.
Estimated prognostic models for four senescence-associated genes. Heat map of risk in all HCC samples, EZH2,G6PD,LGALS3,PSMD14 increased with increasing risk score (A). Risk heat map of the training set (B). Risk heat map of the test set (C). Plot of correlation between survival rate and risk score, showed so the risk status of patients with hepatocellular carcinoma (D). Correlation plot between training set survival rate and risk score. E Correlation plot between test set survival and risk score (F). Scatterplot of patient survival in the high and low survival groups of all HCC samples (G). Scatterplot of patient survival rates in the high and low survival groups in the training set (E). Scatterplot of patient survival in the high and low survival groups in the test set (F). Kaplan-Meier survival curves for patients with low risk scores and patients with high risk scores in all HCC patients, Patients with high-risk scores had significantly shorter survival than those with low-risk scores (J). Kaplan-Meier survival curve for the training set (K). Kaplan-Meier survival curve for the test set (L)

