Fig. 5.
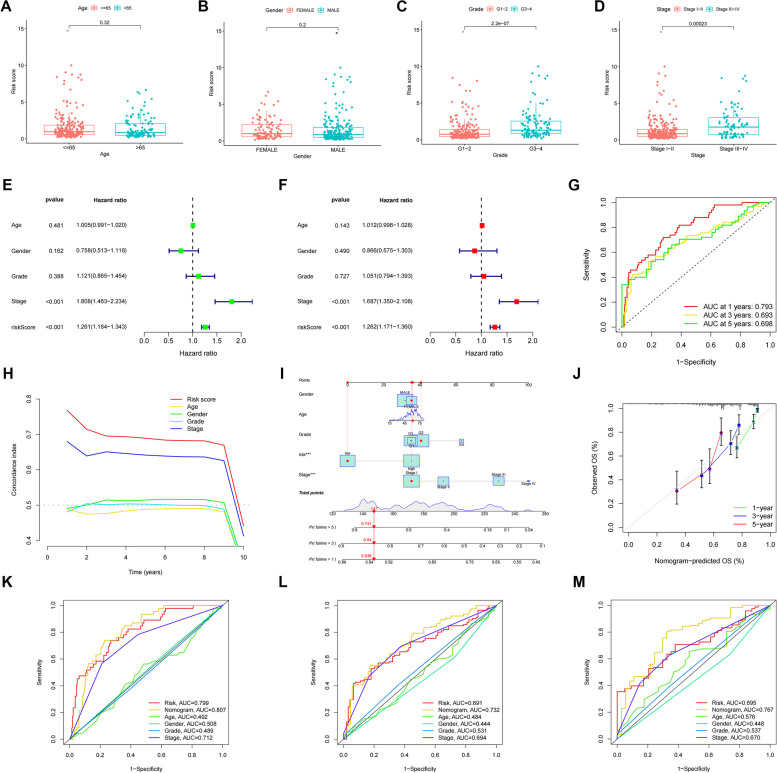
Predicting the prognosis of HCC patients. Risk scores for clinical characteristics (age, gender, class and stage). Age-related risk scores, P>0.01 (A). Gender-related risk scores, P>0.01 (B). Grade-related risk scores, P<0.001 (C). stage-related risk scores, P<0.001 (D). Univariate Cox regression analysis of the training set., Risk Score, P<0.001 (E). Multivariate Cox regression analysis of the test set, Risk Score, P<0.001 (F). ROC curve (AUC) area predicts risk score characteristics for 1-, 3-, and 5-year overall survival.AUC at 1 years:0.793, AUC at 3 years:0.693, AUC at 5 years:0.698 (G). C-index graph, The C-index values for risk scores were all higher than the four clinical characteristics of age, gender, grade, and stage (H). Nomogram,when total number of HCC patients was 147, the 1-year predicted patient survival rate was greater than 0.936, the 3-year predicted patient survival rate was greater than 0.84, and the 5-year predicted survival rate was greater than 0.741 (I). The calibration curves. x-axis is the Nomogram predicted survival and y-axis is the actual survival, and the calibration curves are almost identical to the predicted ones (J). Nomogram ROC curve (K). Training set Nomogram ROC curve (L). Testing set Nomogram ROC curve (M)

