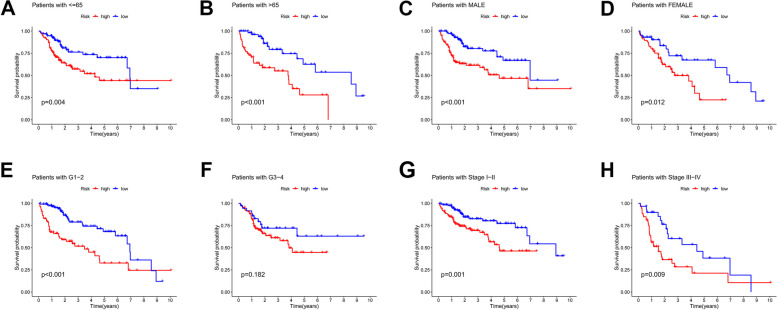
Fig. 6.
Kaplan-Meier survival curves for different clinical subgroups. including different ages (≤65 and >65), different genders, and different grades and stages. Survival curves for patients ≤65, P<0.01 (A). Survival curves for patients >65 years of age, P<0.001 (B). Survival curve of male patients, P<0.001 (C). Survival curve of female patients, P=0.012 (D). Survival curves for grade G1-2 patients, p<0.001 (E). Survival curves for grade G3-4 patients, p=0.182 (F). Survival curves for staged I-II patients,P=0.001 (G). Survival curves for staged III-IV patients, P=0.009 (H)

