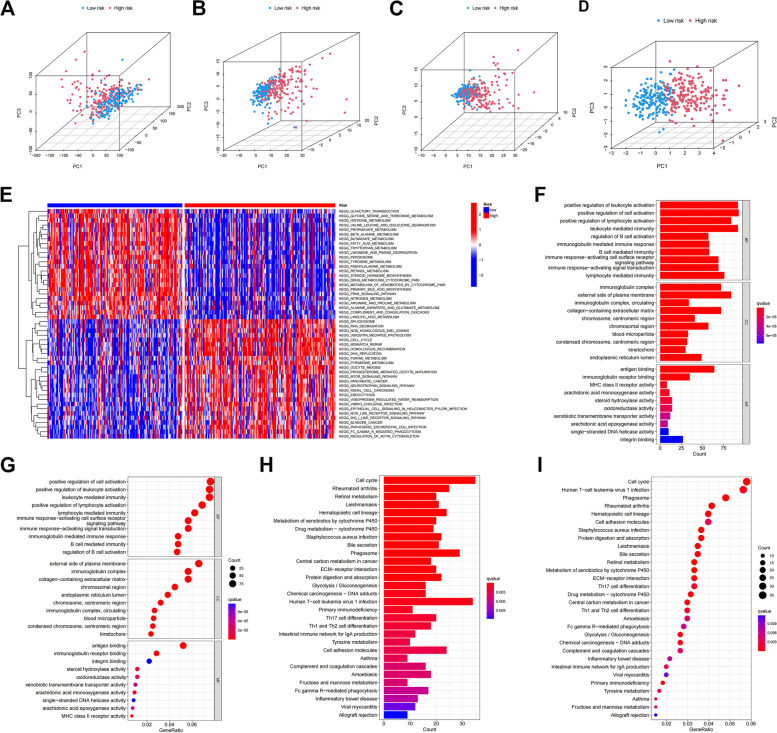
Fig. 7.
Functional and pathway enrichment analysis of different senescence-related genes. Differences in gene expression distribution throughout (A). Differences in the distribution of senescence gene expression (B). Differences in the expression distribution of senescence-related genes (C). Differences in the distribution of risk model expressions (D). Heat map of GSVA enrichment difference analysis between high risk and low risk groups (E). GO enrichment in the TCGA cohort. The vertical coordinate is the name of the GO, and the horizontal coordinate is the proportion of the gene (F, G). KEGG enrichment in the TCGA cohort (H, I)

