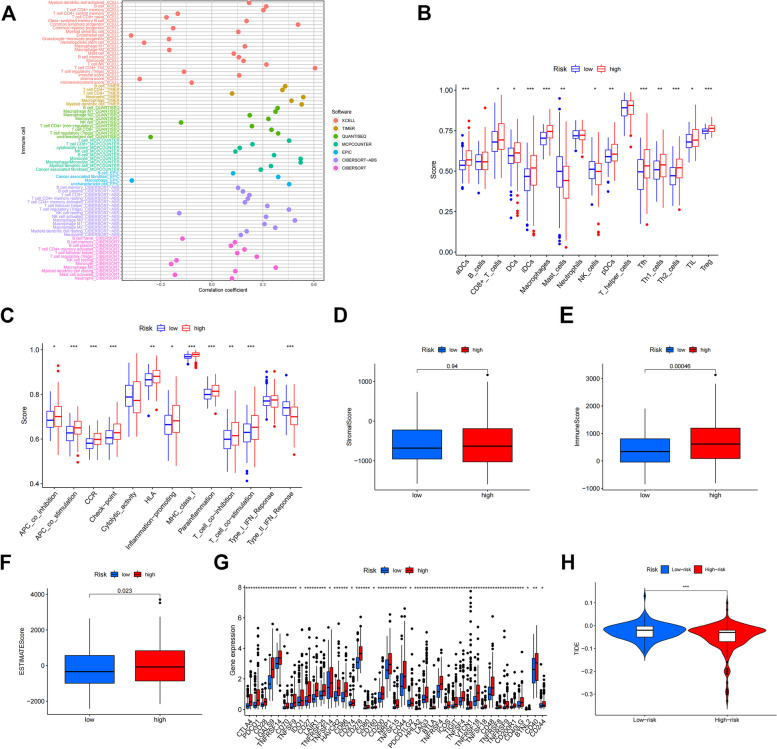
Fig. 8.
Immune cell bubble plots (A). Box plot of the analysis of differences in immune function between high and low risk groups (B). Box plots of high and low risk groups in the analysis of differences in risk groups (C). Stromal score ,The higher the score, the higher the stromal cell content in the tumor microenvironment (D). Immune score, The higher the score, the higher the content of immune cells in the tumor microenvironment (E). Estimate score, The higher the score, the higher the content of stromal cells and immune cells in the tumor microenvironment and the lower the content of tumor cells (F). Differential expression of 41 immune checkpoint expressions in high and low risk groups (G). Violin plot of the analysis of differences in immunotherapy between high and low risk groups (H)

