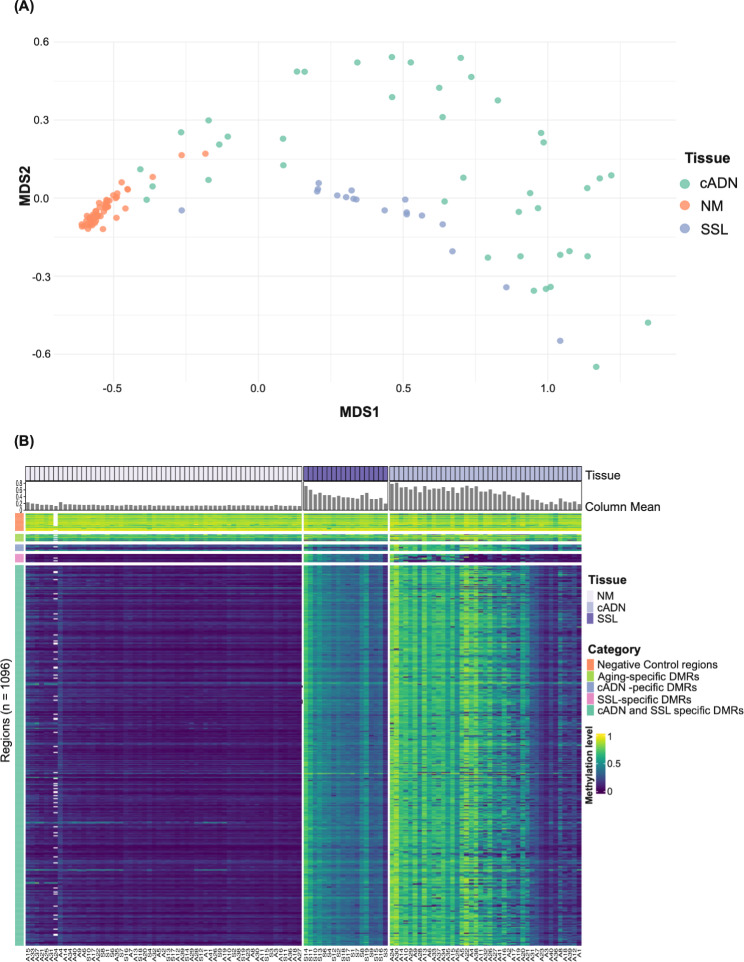
Fig. 2.
Unsupervised analysis of the methylation levels in the 118 tissue samples investigated. (A) Multidimensional scaling (MDS) plot of the samples (cADNs n = 41, SSLs n = 18 and matched NM (n = 59) based on DNA methylation levels in the 100 most variable DMRs. Per-DMR (averaged) methylation levels were subjected to asin/arcsin transformation. (B) Heatmap visualization of mean methylation levels averaged across all CpG sites of each of the 1096 genomic regions analyzed in each tissue sample (numerically coded and prefixed with “A” for cADN or “S” for SSL). In both lesion types, methylation levels at the 990 candidate biomarker DMRs were generally higher than those in their matched NM samples. In contrast, the preCRC and NM methylation profiles for the negative-control and aging-specific DMRs were similar. Column Mean: Mean methylation level per sample (averaged across CpG sites of the 990 candidate biomarker DMRs). White blocks: genomic regions not covered by any reads in the A24 cADN tissue sample

