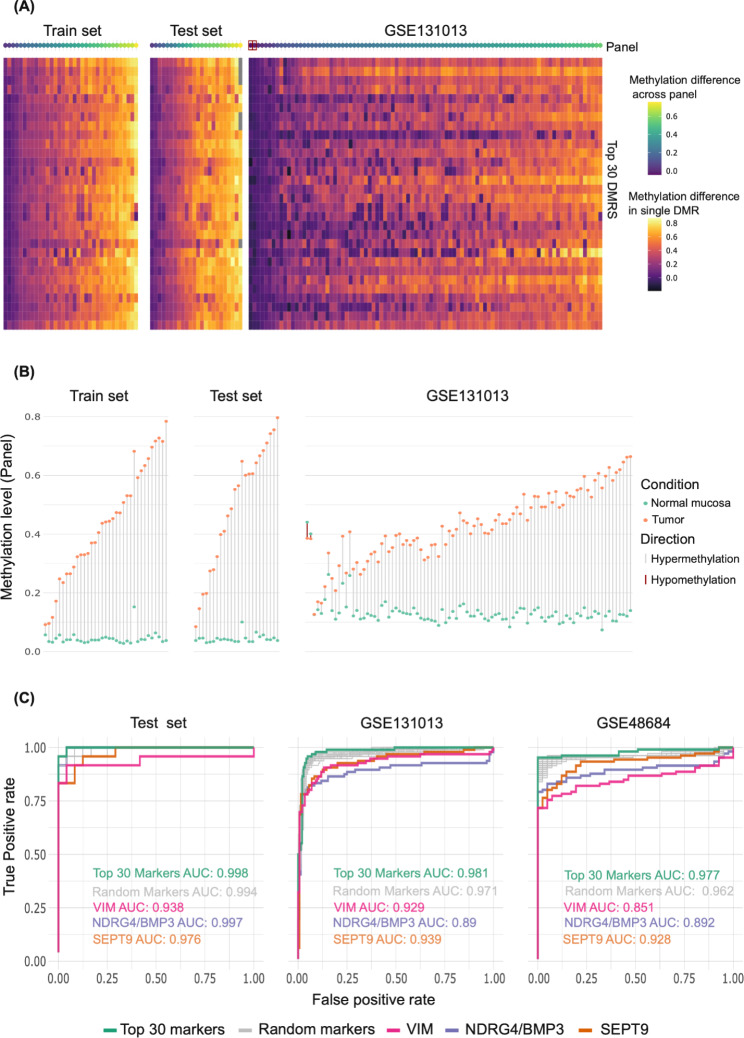
Fig. 3.
Validation of the top 30 candidate markers from Supplementary Table 2. (A) Heatmap showing the difference between per-DMR averaged methylation levels in normal mucosa (NM) and tumor tissues in our training set (70 samples from 35 patients), our test set (48 samples from 24 patients), and the GSE131013 tissue set (180 samples from 90 patients) (see Methods). The top row (“Panel”) shows the average methylation difference per patient across the 30 DMR marker candidates. (Red squares in this row: donors with hypomethylated tumors reflected by a negative average difference between their tumor and NM methylation levels.) Pairwise comparison of methylation levels in the GSE48684 samples could not be performed because per patient paired sample data was not available (see Methods). (B) Averaged methylation levels for the top 30 marker candidates in tumors (orange dots) and paired NM (green dots) for each patient in the three datasets mentioned in (A). (Two tumors of the GSE131013 dataset displayed hypo- rather than hypermethylation relative to their matched NM samples.) (C) Receiver operating characteristic (ROC) curves showing the differentiating potential of the “per sample mean methylation level” at our top 30 candidate marker DMR set, at the 100 randomly selected sets of 30 DMRs from our Supplementary Tables 2, at VIM DMR, at NDRG4/BMP3 DMR and at SEPT9 DMR in our test dataset and the GSE131013 and GSE48684 datasets. AUCs are given in each graph (the AUC of the randomly selected sets of 30 DMRs, i.e., gray curve, represents the mean of AUCs obtained across all 100 random sets)

