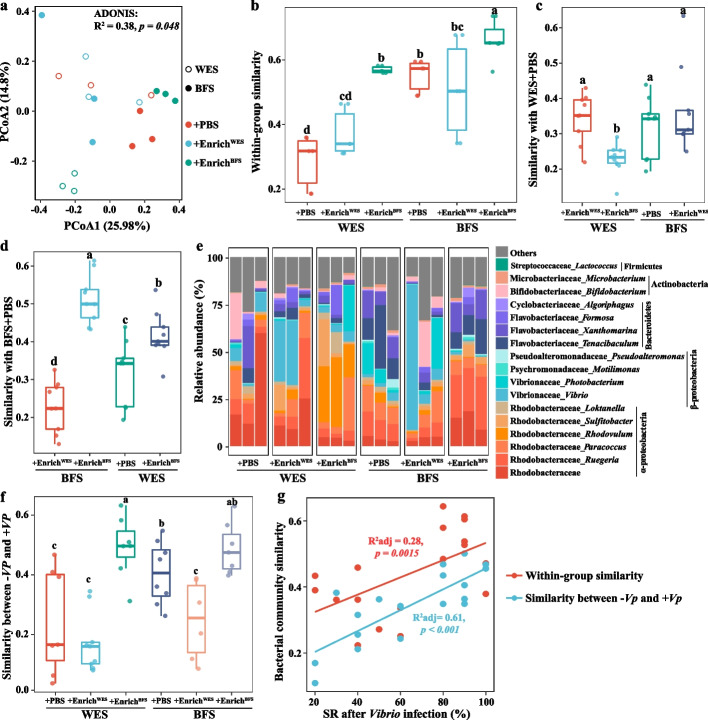
Fig. 3.
The gut bacterial community characteristics of shrimp after cross-transplantation of gut bacterial consortia. a Principal coordinate analysis (PCoA) plots based on the Bray–Curtis dissimilarity. b The within-group similarities of bacterial community of shrimp gut samples after cross-transplantation. c The bacterial community similarities of WES + PBS and other groups. d The bacterial community similarities of BFS + PBS and other groups. e The bacterial community compositions after cross-transplantation. f The gut bacterial community similarities of shrimp between non-Vibrio infection and Vibrio infection. The boxes represent the median and interquartile range, and whiskers range from minimum to maximum values. Each sample had three replicates (n = 3). Different letters indicate a significant difference at p < 0.05 based on Student’s t test. g The linear relationships of bacterial community similarity and survival rates after Vibrio infection. Adjusted R2 values and the significance levels are displayed for each of the linear regressions. WES, Water exchange system; BFS, Biofloc system; PBS, Phosphatic buffer solution; EnrichWES, Bacterial consortium obtained from WES shrimp; EnrichBFS, Bacterial consortium obtained from BFS shrimp; − Vp, non-Vibrio infection; + Vp, Vibrio infection; SR, Survival rate

