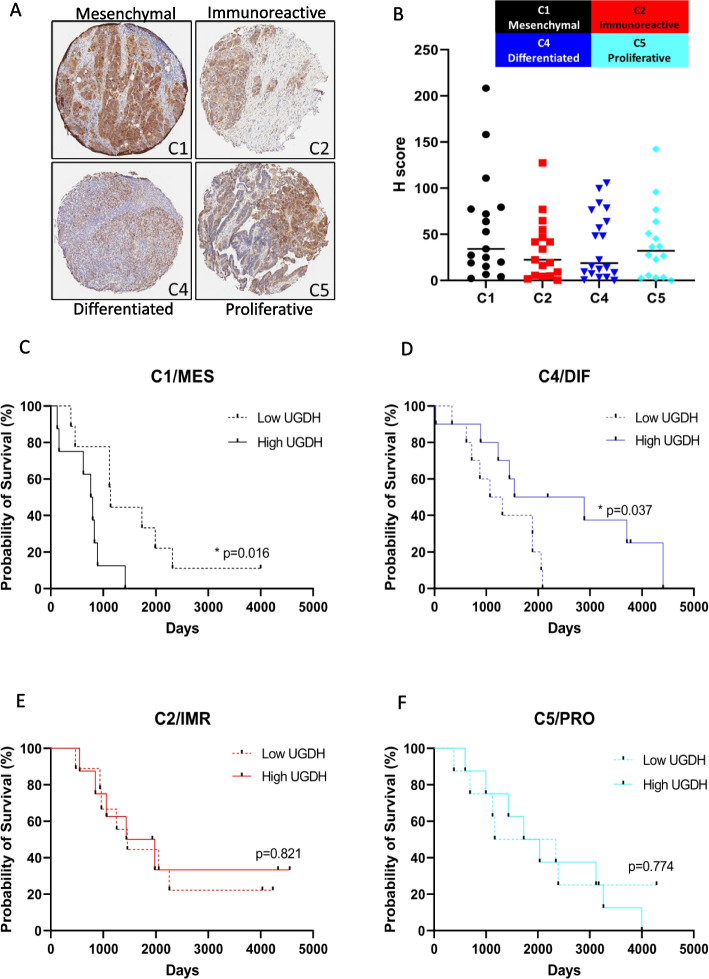
Fig. 3.
UGDH expression in molecular subtypes of high grade epithelial ovarian cancers. A Representative images of UGDH expression in TMA cores from molecular subtypes C1, C2, C3 and C4 at 4X magnification. B Expression of UGDH expressed as H-score. C Survival analysis of C1 subtype comparing low versus high UGDH H-score (above or below the median). D Survival analysis of C4 subtype comparing low versus high UGDH H-score (above or below the median). E Survival analysis of C2 subtype comparing low versus high UGDH H-score (above or below the median). F Survival analysis of C5 subtype comparing low versus high UGDH H-score (above or below the median)

