Fig. 7.
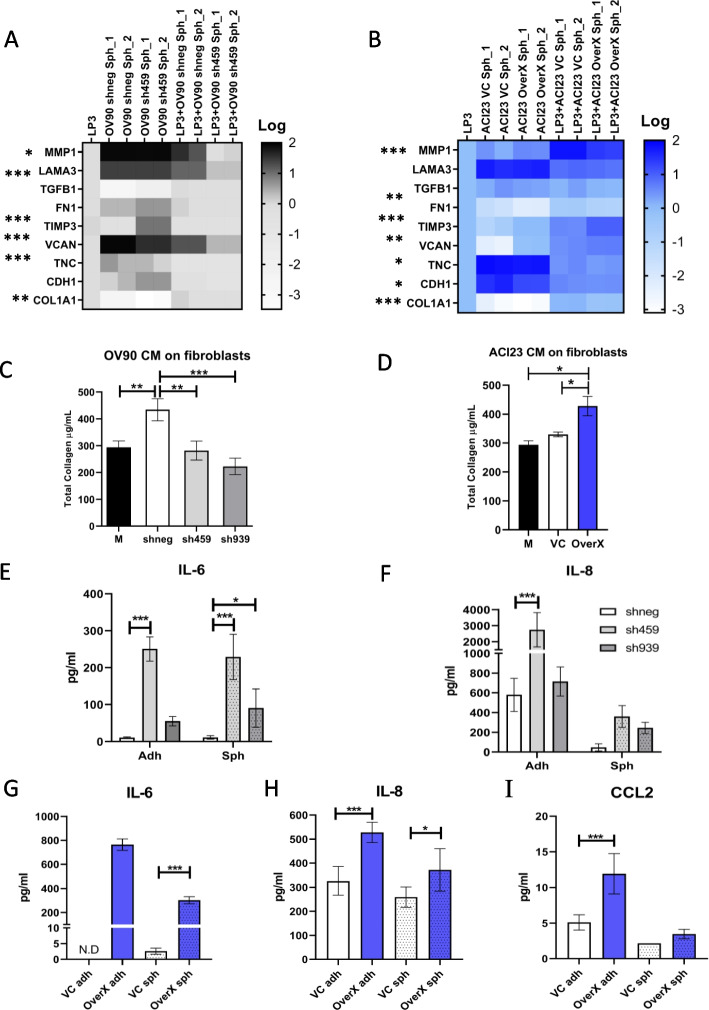
Changes to UGDH expression in spheroids alters cells and cytokines of the tumor microenvironment in vitro. In (A) and (B), spheroids were generated, and knockdown induced with DOX before co-culture with LP3 mesothelial adherent monolayers for 24 h and gene expression of co-cultures was measured by qRT-PCR. A Heatmap of expression of genes altered in OV90 control spheroids (shneg) compared to OV90 spheroids with UGDH knocked down (sh459), and in co-culture with LP3 cells, relative to LP3 cells alone. B Heatmap of expression of genes altered in ACI23 control spheroids (VC) compared to ACI23 spheroids with UGDH overexpression (OverX), and in co-culture with LP3 cells, relative to LP3 cells alone. Total collagen content of fibroblasts was measured after 3 days culture in conditioned medium from: C OV90 control cells (shneg) or OV90 cells with UGDH knocked down (sh459. sh939) compared to OV90 culture medium (M), D ACI23 cells with UGDH overexpression (OverX) or vector control (VC) compared to ACI23 culture medium (M). Expression of (E) IL-6 (F) IL-8 in supernatant from OV90 adherent cells or spheroids with UGDH knockdown (sh459, sh939) compared to controls (shneg). Expression of (G) IL-6 (H) IL-8 (I) CCL2 in supernatant from ACI23 adherent cells or spheroids with UGDH overexpression (OverX) compared to controls (VC). N.D not detected, *p < 0.05, **p < 0.01, ***p < 0.001

