
Figure 1.
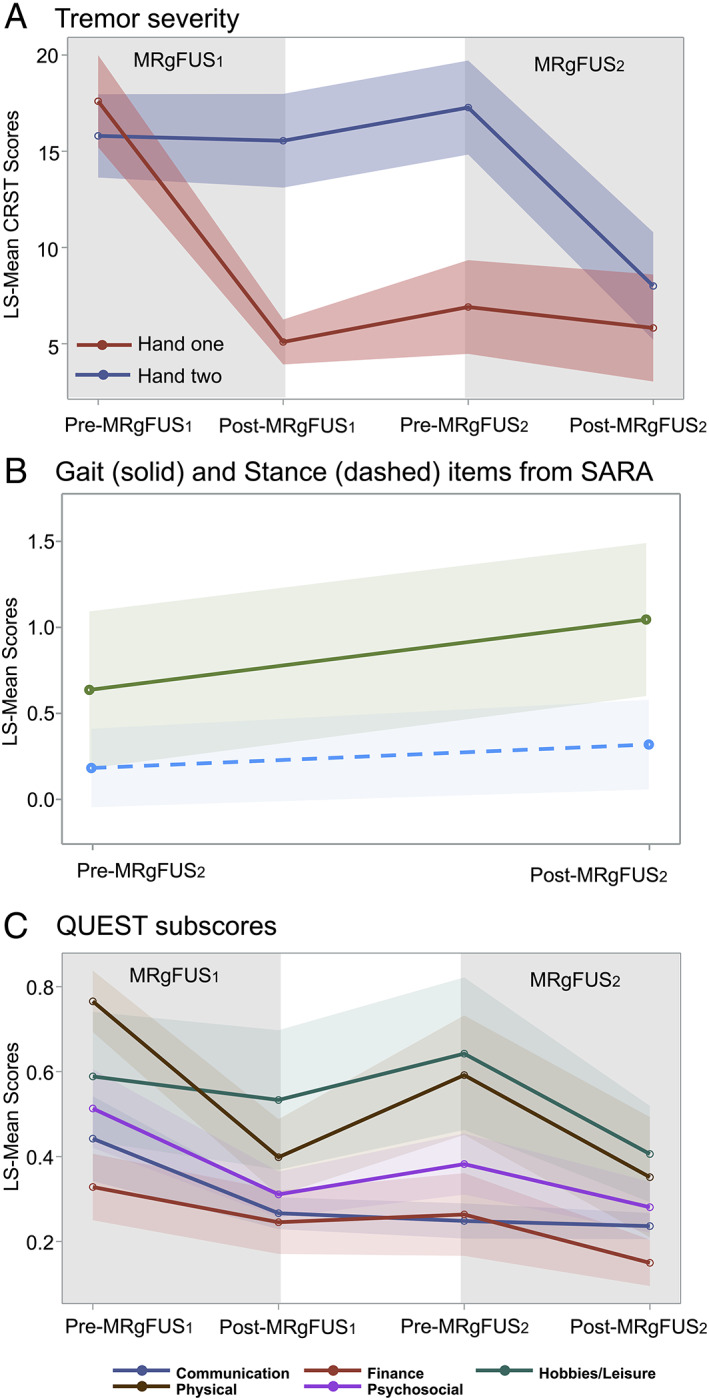
(A) Tremor severity. Group scores from Part A (resting, postural, action/intention) and Part B (Archimedes spiral/line drawing, water pouring) of the CRST for the hand treated in the first procedure (Hand one; MRgFUS1) and the second procedure (Hand two, MRgFUS2) plotted as least square means (CRST LS‐MEAN). Shaded areas CI‐95%. Baseline measures were collected <2 weeks prior to each MRgFUS procedure. Follow‐up measures were collected median 3.9 months after MRgFUS1 and median 4.4 months after MRgFUS2. Higher scores suggest worse tremor. (B) Equilibrium assessment for MRgFUS2. Gait and stance items of the SARA plotted as least square means (SARA LS‐MEAN). Higher scores suggest worse equilibrium. Shaded areas CI‐95%. (C) Quality of life. QUEST domain scores were reported as a percentage of the highest possible total for that given domain. Higher scores suggest worse quality of life. Shaded areas CI‐95%.