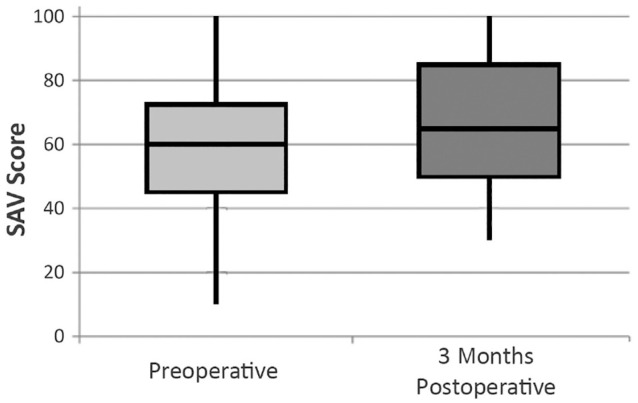
Figure 2.

Distribution of the Simple Ankle Value (SAV) for preoperative and 3 months postoperative in the operated group. In operative group: Low mustache, minimum SAV score of the series; high mustache, maximum SAV score of the series; low box, 1st quartile value; high box, 3rd quartile value; horizontal line, median value.
