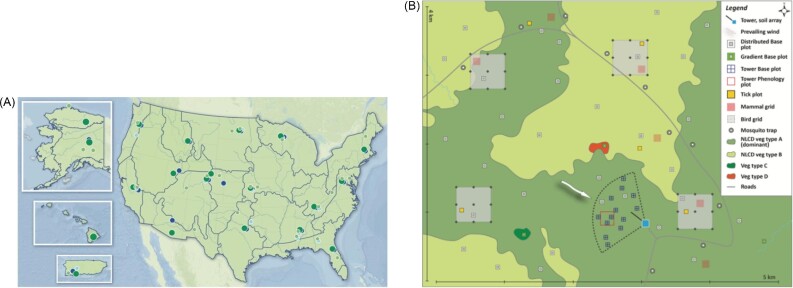
Box 1, Fig. 1.
Spatial scales of NEON sampling. (A) The distribution of NEON sites across ecoregion boundaries in the United States (insets show Alaska, Hawaii, and Puerto Rico). Terrestrial sites are in green, while aquatic sites are in blue; larger, darker circles show NEON Core Sites (which are natural and undisturbed), while smaller, lighter circles show NEON Gradient Sites (which are impacted by human activities). Each site consists of an array of embedded plots at which sampling or automated data collection occur. See interactive map here: https://www.neonscience.org/field-sites/explore-field-sites. (B) An expanded view of a typical NEON Core terrestrial site containing multiple types of data collection.

