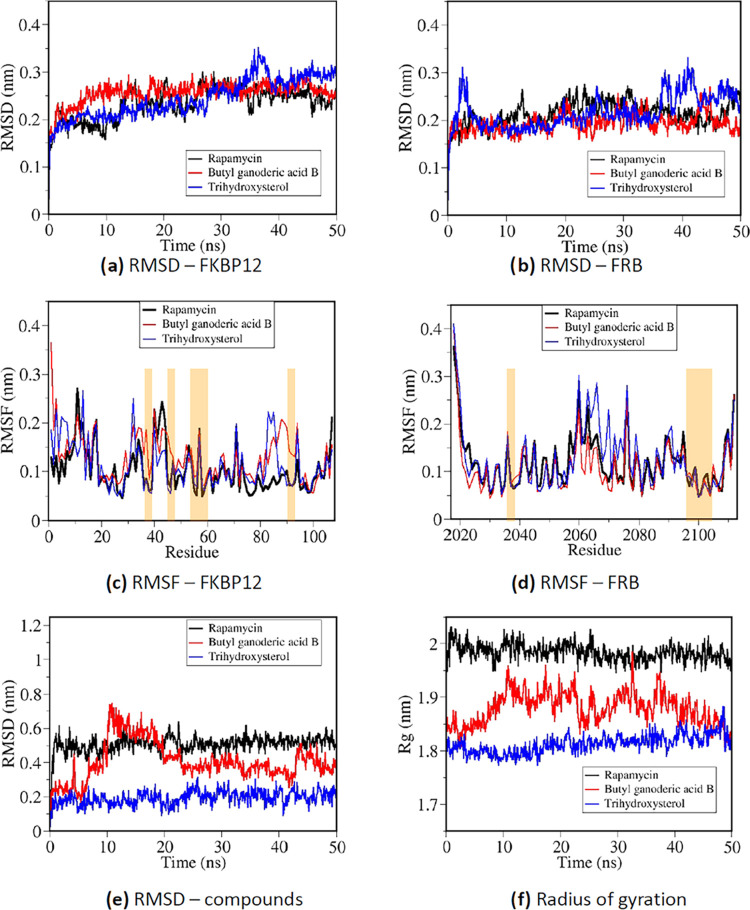
Figure 4.
Conformational analysis from three 50 ns MD trajectories of rapamycin and the two selected compounds binding with the FRB–FKBP12 complex. (a) RMSD of the FKBP12 protein compared to the starting structure, (b) RMSD of the FRB protein compared to the starting structure, (c) RMSF per residue of the FKBP12 protein, (d) RMSF per residue of the FRB protein, (e) RMSD of each compound compared to the starting binding configuration, and (f) radius of gyration representing the compactness of each system.

