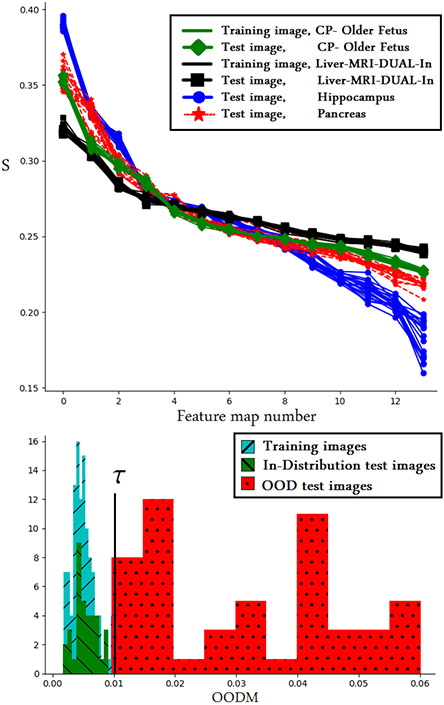
Fig. 2.
A demonstration of our proposed OOD detection method. Here, the model is trained on several datasets including CP-older fetus, Heart, and Liver-MRI-DUAL-In. TOP: Spectral signatures of four datasets, two of which (CP-older fetus and Liver-MRI-DUAL-In) are from the training data, while the other two (Hippocampus and Pancreas) are OOD. The spectra for the training and test samples for in-distribution data are very similar and not visually distinguishable. BOTTOM: Histograms of OODM, where OOD test images are from Pancreas, Hippocampus, and Spleen datasets. The value of the threshold τ = 0.011 is marked with the vertical black line.

