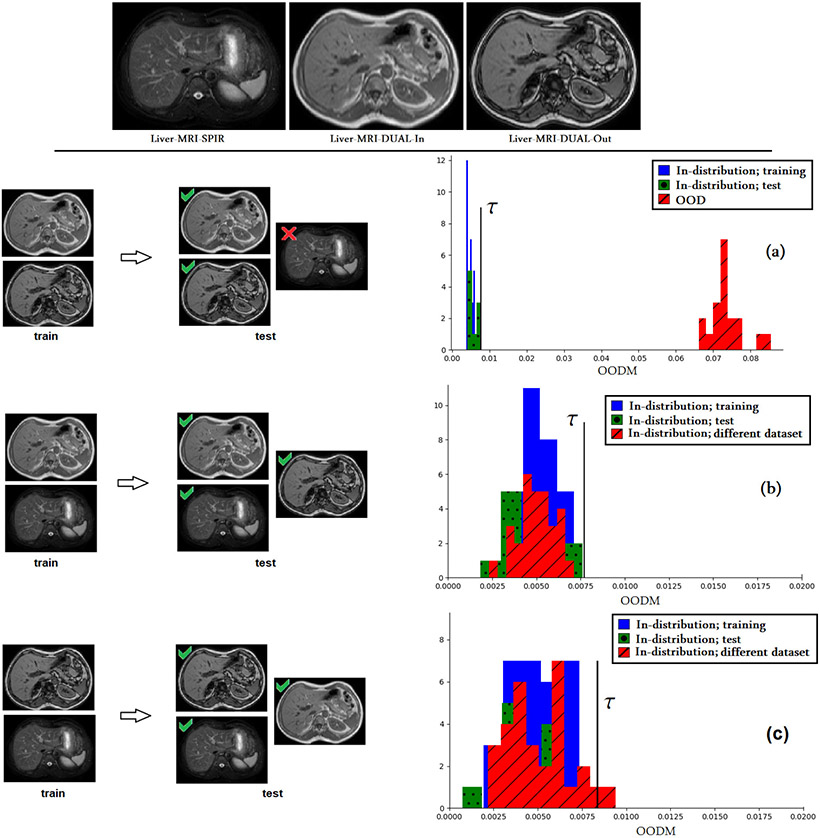
Fig. 9.
TOP: Sample images from the three liver MRI datasets. BOTTOM: The results of OOD detection experiment when different pairs of these three datasets are used for training. In the left section, green ✓ and red ✗ symbols, respectively, denote success and failure at test time. (a) The model was trained on Liver-MRI-DUAL-In and Liver-MRI-DUAL-Out datasets. The OOD data included Liver-MRI-SPIR dataset, on which the model failed at test time. OODM perfectly separated the OOD data from in-distribution data. (b) Liver-MRI-SPIR and Liver-MRI-DUAL-In datasets were used for training. At test time the model accurately segmented Liver-MRI-DUAL-Out dataset (DSC= 0.886). OODM values for Liver-MRI-DUAL-Out are distributed similar to the training data. (c) Liver-MRI-SPIR and Liver-MRI-DUAL-Out were used for training. Note that the scales of the horizontal axes in (b) and (c) are different from (a).

