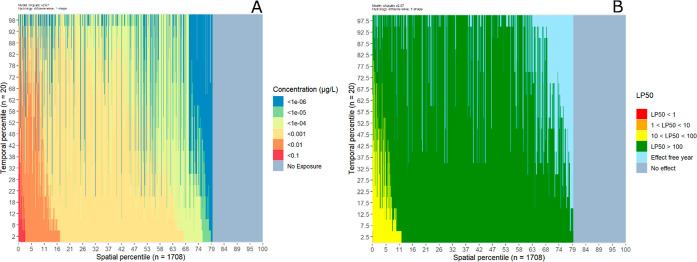
Figure 4.
Spatiotemporal percentile plots of PECmax surface water (A) and LP50 values (B). Columns represent individual reaches; rows represent the 20 years in the assessment period. First, PECmax and LP50 are sorted within reaches in descending and ascending order, respectively (i.e., highest PECmax and lowest LP50 at the bottom). Next, reaches are sorted along the x-axis such that the reaches with the highest PECmax and lowest LP50 value in a year are located in the bottom left corner. No exposure (A) indicates reaches that have no exposure during the 20 year period; effect free year and no effect (B) indicate reaches where no fit of the LP50 value was possible or where no exposure occurs, respectively. Results were based on simulation with 75% drift reduction and a 10 m buffer as mitigation options.

