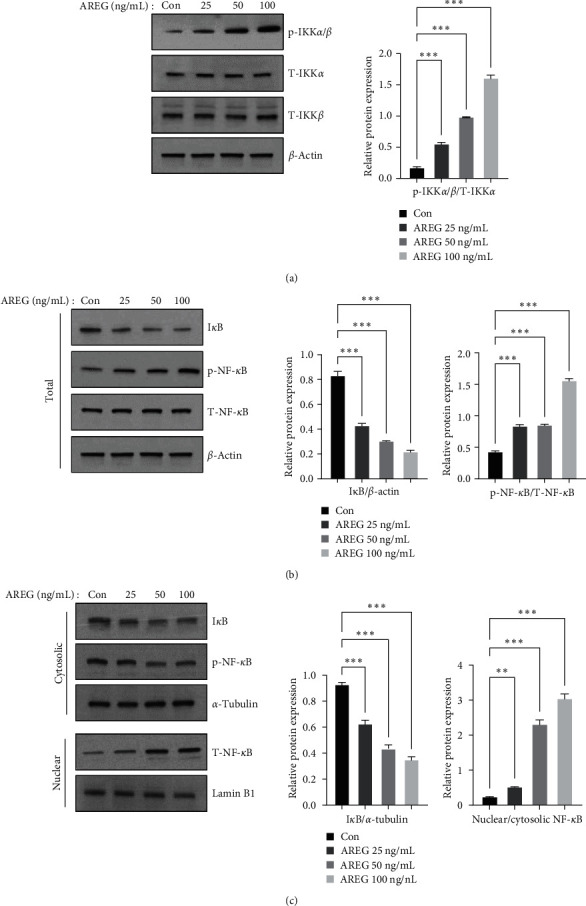
Figure 3.

IKK/NF-κB signaling was activated by AREG in HepG2 cells. HepG2 cells were treated with different concentrations of AREG (25–100 ng/mL) for 1 hr. (a) IKK signaling was analyzed using anti-phospho-IKKα/β, anti-IKKα, anti-IKKα, and anti-actin antibodies. (b) IκB and NF-κB signaling was analyzed using anti-phospho-NF-κB, anti-NF-κB, anti-IκB, and anti-actin antibodies. (c) The cytoplasmic and nuclear extracts were examined by immunoblotting analysis using anti-NF-κB, anti-IκB, anti-α-tubulin, and anti-Lamin B1 antibodies. Graphs represent the ratio between the phosphorylated protein and the total amount of the targeted protein. ∗P < 0.05, ∗ ∗P < 0.01, and ∗ ∗ ∗P < 0.001 compared to the control conditions (no drug).
