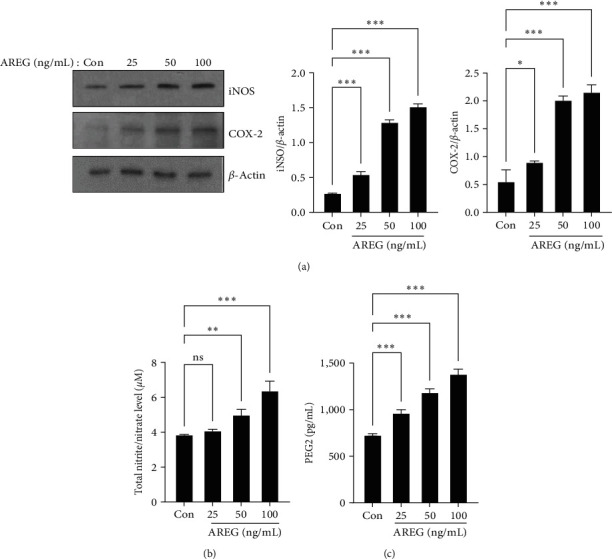
Figure 5.

iNOS and COX-2 expression and NO and PGE2 release were increased by AREG in HepG2 cells. HepG2 cells were treated with different concentrations of AREG (25–100 ng/mL) for 24 hr. (a) The expression levels of iNOS and COX-2 were analyzed by western blotting. (b) NO and (c) PGE2 productions were determined in cell culture media from HepG2 cells. Data are expressed as mean ± standard deviation of three independent experiments. ∗P < 0.05, ∗ ∗P < 0.01, and ∗ ∗ ∗P < 0.001 compared with the control conditions (no drug).
