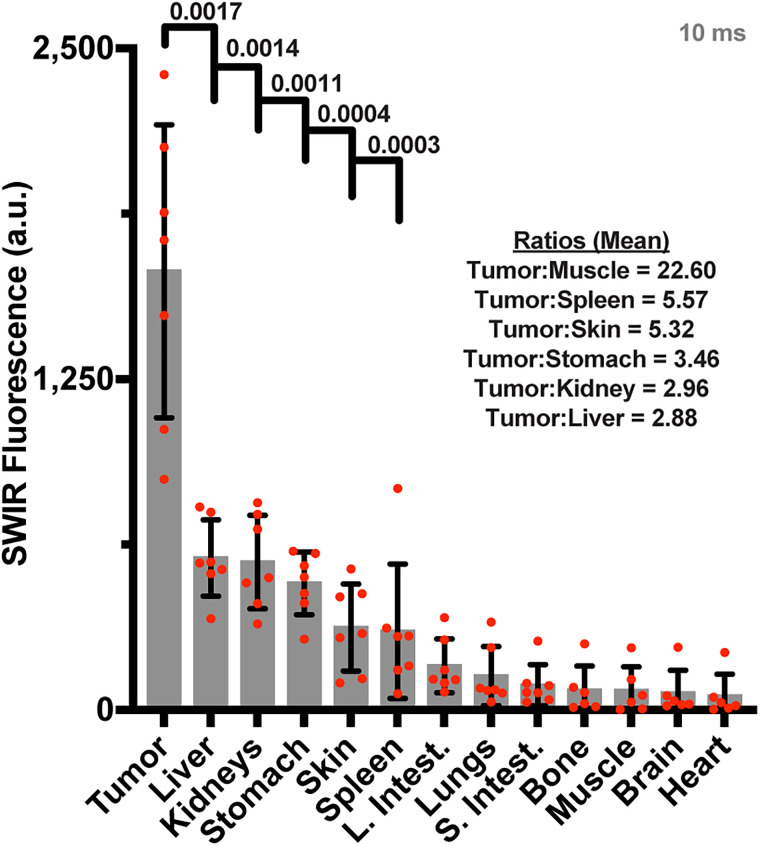
FIGURE 4.
Ambient lighting resistant SWIRFI necropsy biodistribution. SWIRFI organ values. Respective endogenous values from control mice imaged under comparative conditions have been subtracted for each. Mean, standard deviation, and biologic replicates (n = 7) are shown, negative values after endogenous level subtraction are not shown. Select P values (<0.05, Welch 2-tailed t test, unpaired, parametric) and ratios comparing tumor to select tissues are shown. a.u. = arbitrary unit; L. Intest. = large intestine; S. Intest. = small intestine.

