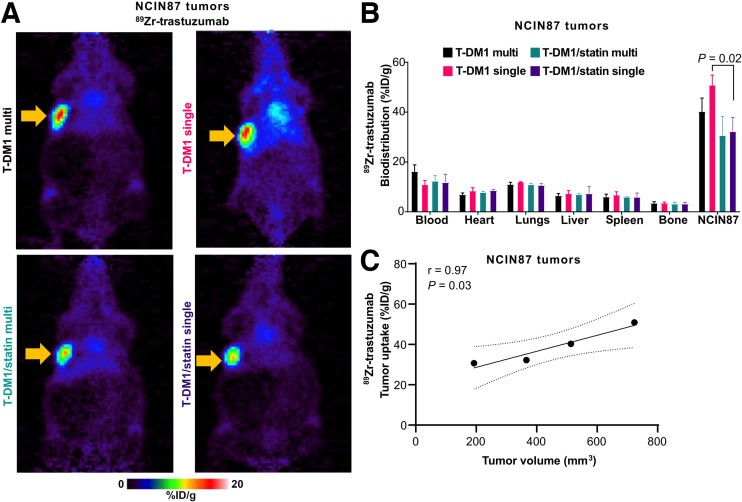
FIGURE 2.
(A and B) Representative PET images (A) and biodistribution (B) of [89Zr]Zr-DFO-trastuzumab displaying %ID/g acquired 48 h after radiolabeled trastuzumab injection on day 39 for T-DM1 single-treatment regime, T-DM1/statin single-treatment regime, T-DM1 multiple-treatment regime, and T-DM1/statin multiple-treatment regime. Tumor location is indicated by arrow. Data are mean ± SD (n = 4). Significant P values (<0.05) are displayed for tumor mean comparisons and were calculated by unpaired Student t test. (C) Scatterplot of mean %ID/g of [89Zr]Zr-DFO-trastuzumab in tumor regions against tumor volume (mm3). Pearson correlation coefficient (r) and P value are displayed. Line of best fit is displayed (solid black line) with 95% CIs (dotted black lines).

