. 2023 Oct 19;131(10):107011. doi: 10.1289/EHP12097

Figure 3.

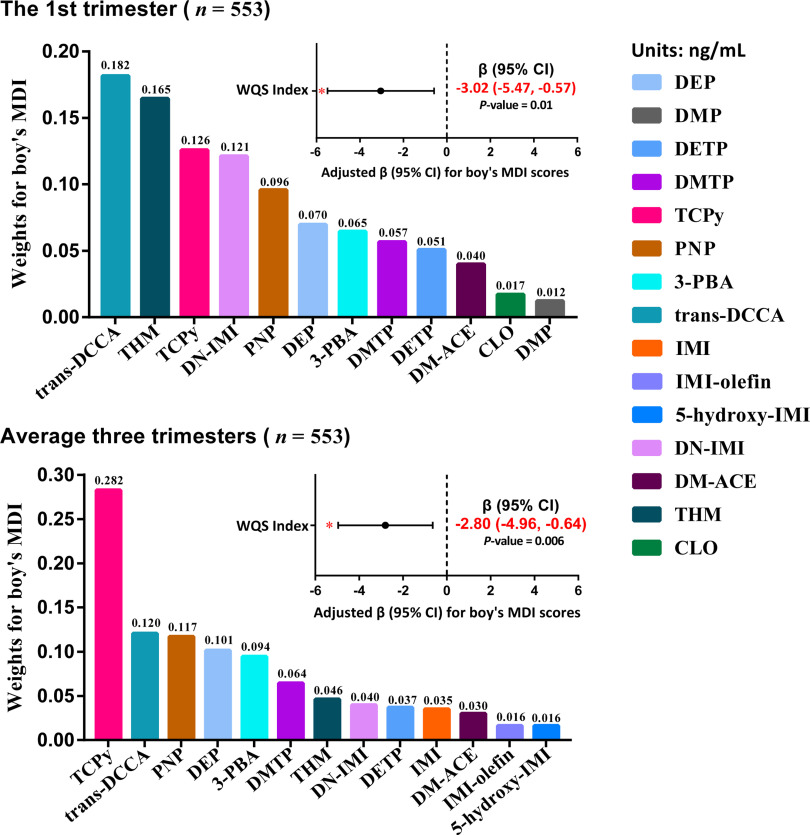
Figure 3 is a set of two bar graphs and two line graphs. The bar graphs are titled The first trimester and Average three trimesters, plotting weights for boy’s mental development index, ranging from 0.00 to 0.20 in increments of 0.05 and 0.00 to 0.30 in increments of 0.05 (y-axis) across trans-3-(2,2-dichlorovinyl)-2,2-dimethylcyclopropanecarboxylic acid, thiamethoxam, 3,5,6-trichloro-2-pyridinol, desnitro-imidacloprid, 4-nitrophenol, diethyl phthalate, 3-phenoxybenzoic acid, dimethylthiophosphate, diethyl thiophosphate, desmethyl-acetamiprid, clothianidin, dimethyl phosphate; and 3,5,6-trichloro-2-pyridinol, trans-3-(2,2-dichlorovinyl)-2,2-dimethylcyclopropanecarboxylic acid, 4-nitrophenol, diethyl phthalate, 3-phenoxybenzoic acid, dimethylthiophosphate, thiamethoxam, desnitro-imidacloprid, diethyl thiophosphate, imidacloprid, desmethyl-acetamiprid, imidacloprid-olefin, and 5-hydroxy-imidacloprid (x-axis) for units: nanograms per milliliter, including diethyl phthalate, dimethyl phosphate, diethyl thiophosphate, dimethylthiophosphate, 3,5,6-trichloro-2-pyridinol, 4-nitrophenol, 3-phenoxybenzoic acid, trans-3-(2,2-dichlorovinyl)-2,2-dimethylcyclopropanecarboxylic acid, imidacloprid, imidacloprid-olefin, 5-hydroxy-imidacloprid, desnitro-imidacloprid, desmethyl-acetamiprid, thiamethoxam, and clothianidin, respectively. The line graphs plot Weighted quantile sum index (y-axis) across adjusted lowercase beta (95 percent confidence intervals) for boy’s mental development index scores (x-axis) for lowercase beta (95 percent confidence intervals).

Associations between the maternal urinary biomarker mixture and boy’s MDI scores assessed with repeated holdout random subset WQSR in the negative direction, based on the concentrations (ng/mL) in the first trimester (N=553 participants, n=553 samples) and the averaged concentrations (ng/mL) over the three trimesters (N=553 participants, n=1,659 samples) for participants from a birth cohort study in Wuhan, China, 2014–2017. The models were adjusted for maternal age (categorical), PBMI (categorical), maternal education (categorical), passive smoking (categorical), folic acid supplementation during pregnancy (categorical), parity (categorical), breastfeeding duration (categorical), delivery mode (categorical), and sampling seasons (except for average concentrations). *p<0.05 were considered statistically significant. Details of chemical abbreviations are provided in Figure 1, and the numerical values are listed in Table S9. Note: CI, confidence interval; MDI, mental development index; PBMI, prepregnancy body mass index; WQSR, weighted quantile sum regression.