
Fig. 3.
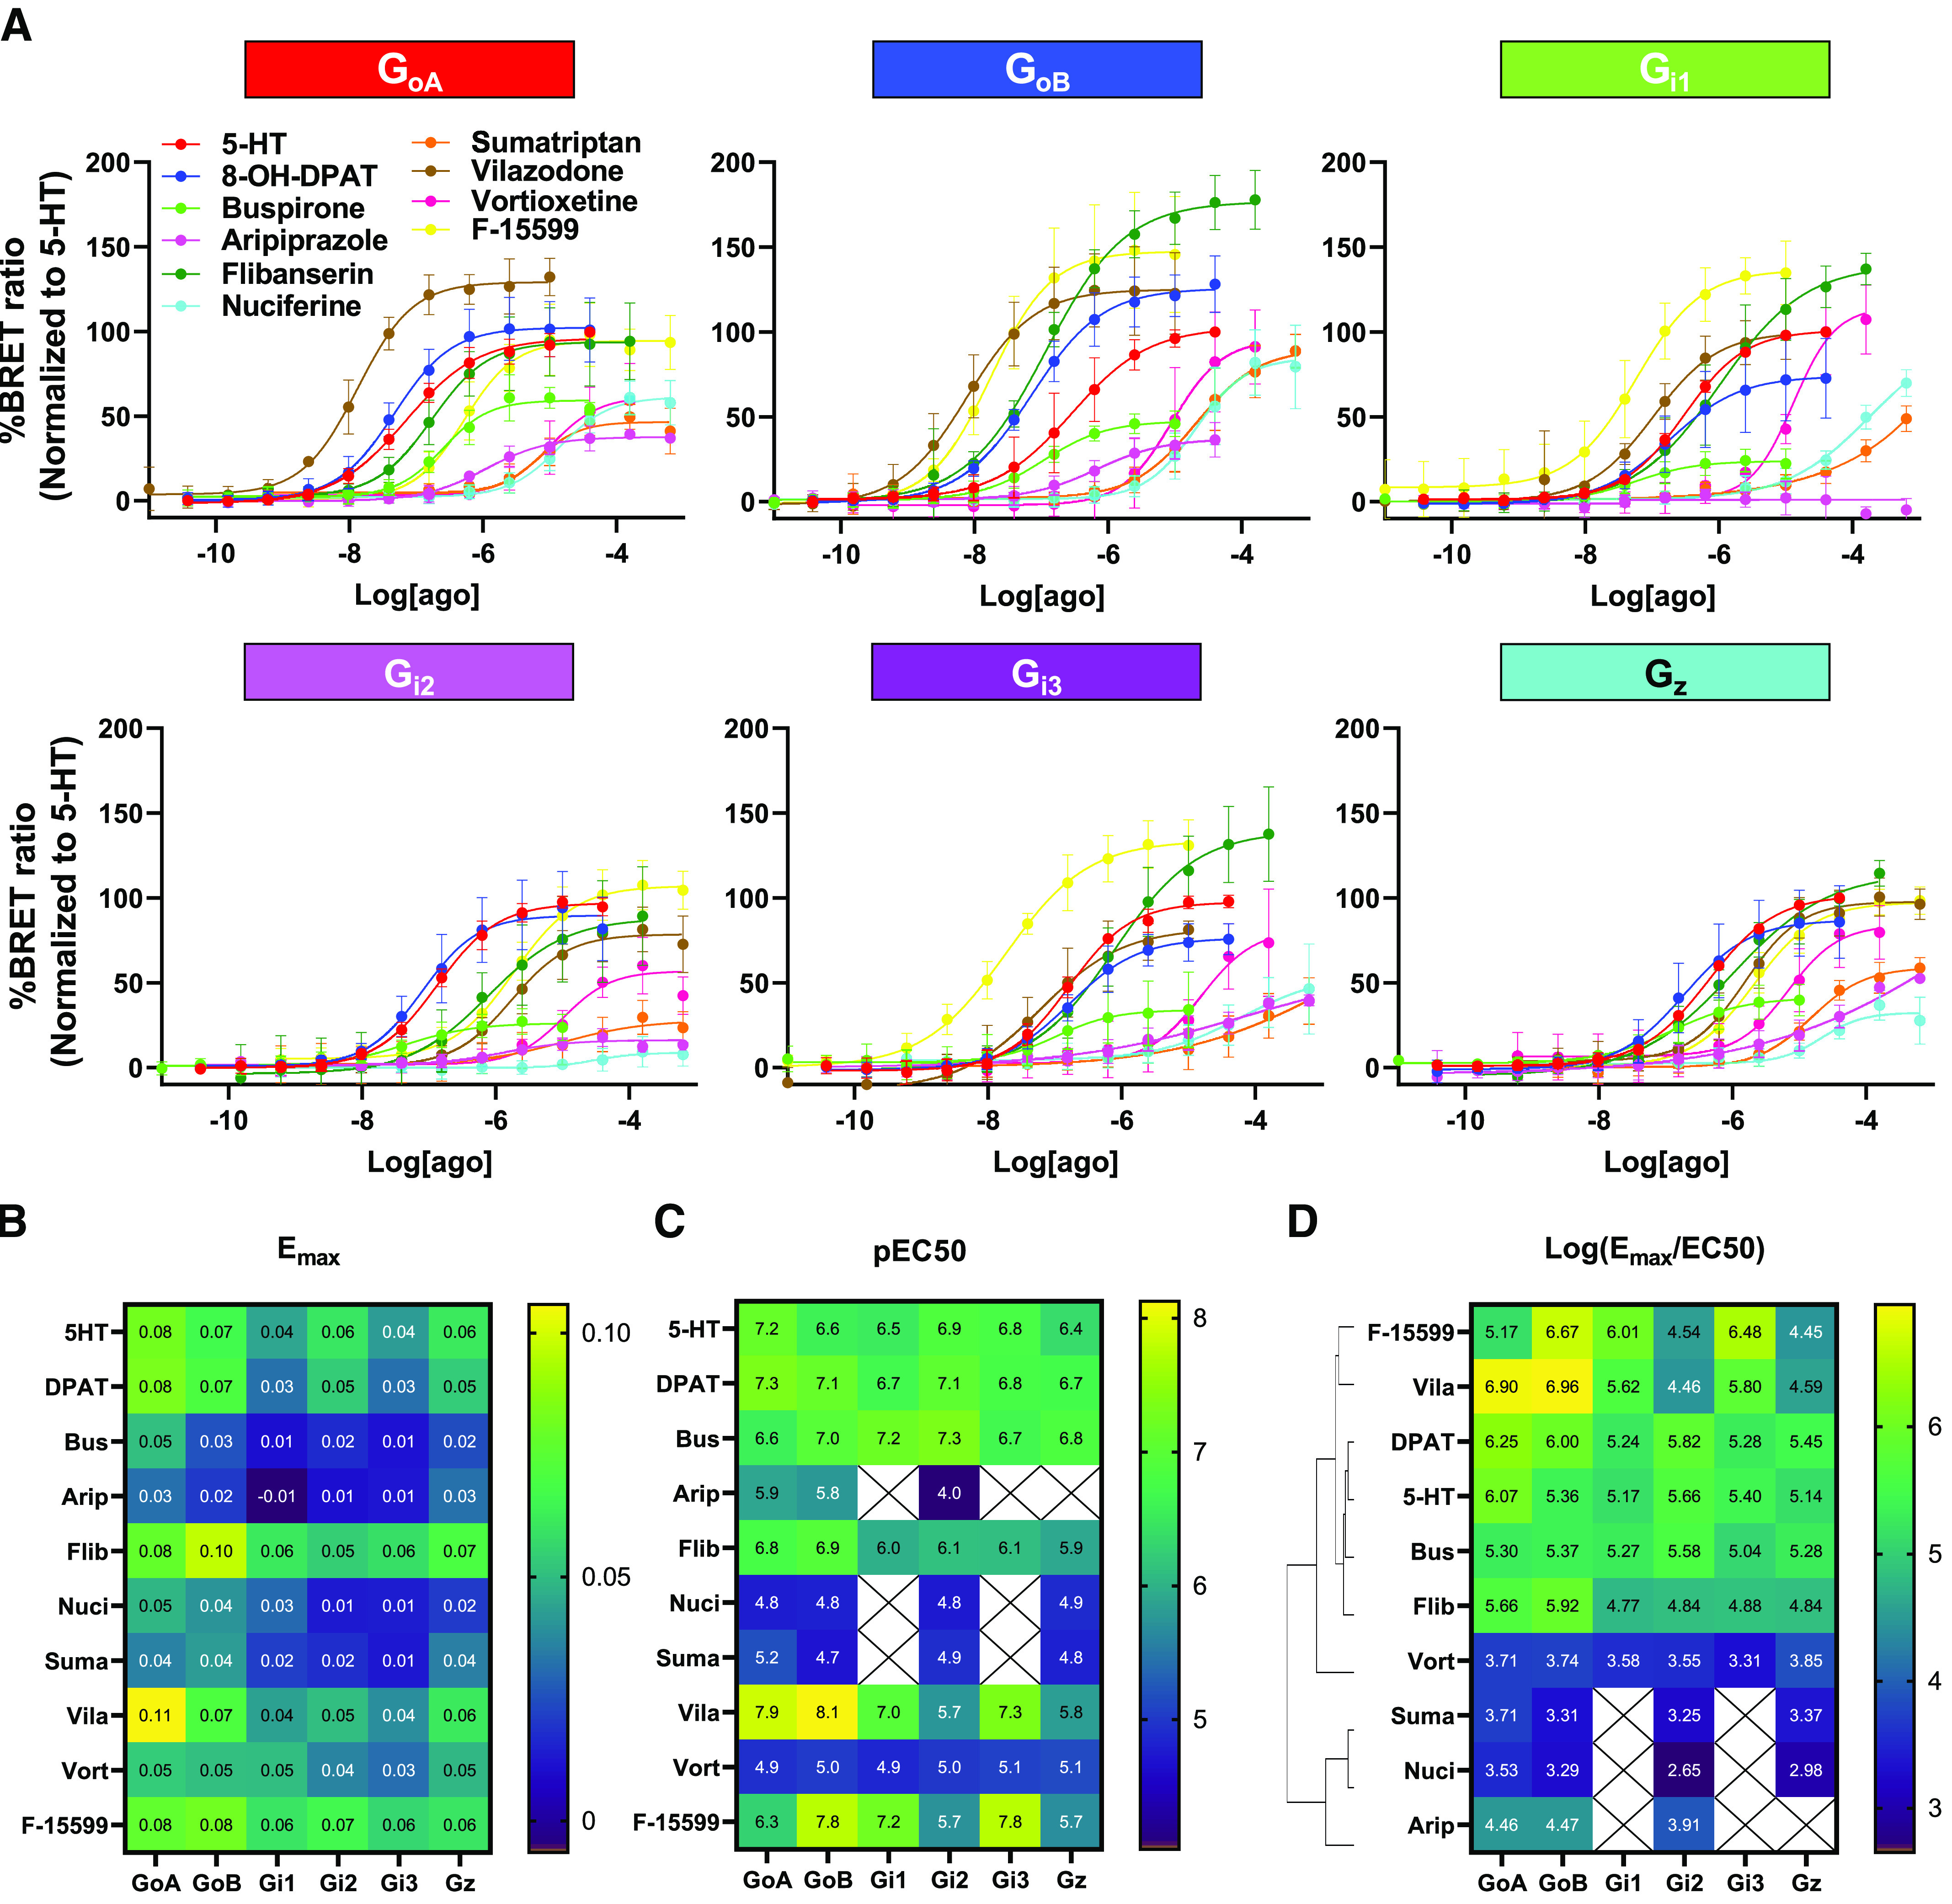
Concentration-response curves and activation heatmaps for each Gα protein obtained with different 5-HT1AR agonists. (A) Full concentration-response curves for each of the ten indicated 5-HT1AR agonists with each of the six Gαi/o/z proteins. Each data point represents the mean ± S.D. (n = 5–10 independent replicates). (B) Efficacy values reported as maximal ΔBRET ratio (Emax) for each 5-HT1AR agonist using the activation of the six Gα proteins as readout. Colors represents the mean Emax value according to the color-coded scale reported to the right (n = 5–10 independent replicates). (C) Potency reported as pEC50 values for each agonist/Gα protein pair. Colors represents the mean pEC50 value according to the color-coded scale reported to the right (n = 5–10 independent replicates). (D) Both values were used to calculate the transduction coefficient as Log(Emax/EC50) and to cluster the ten agonists according to their profile of G protein activation. Colors represent the Log(Emax/EC50) value according to the color-coded scale reported to the right.