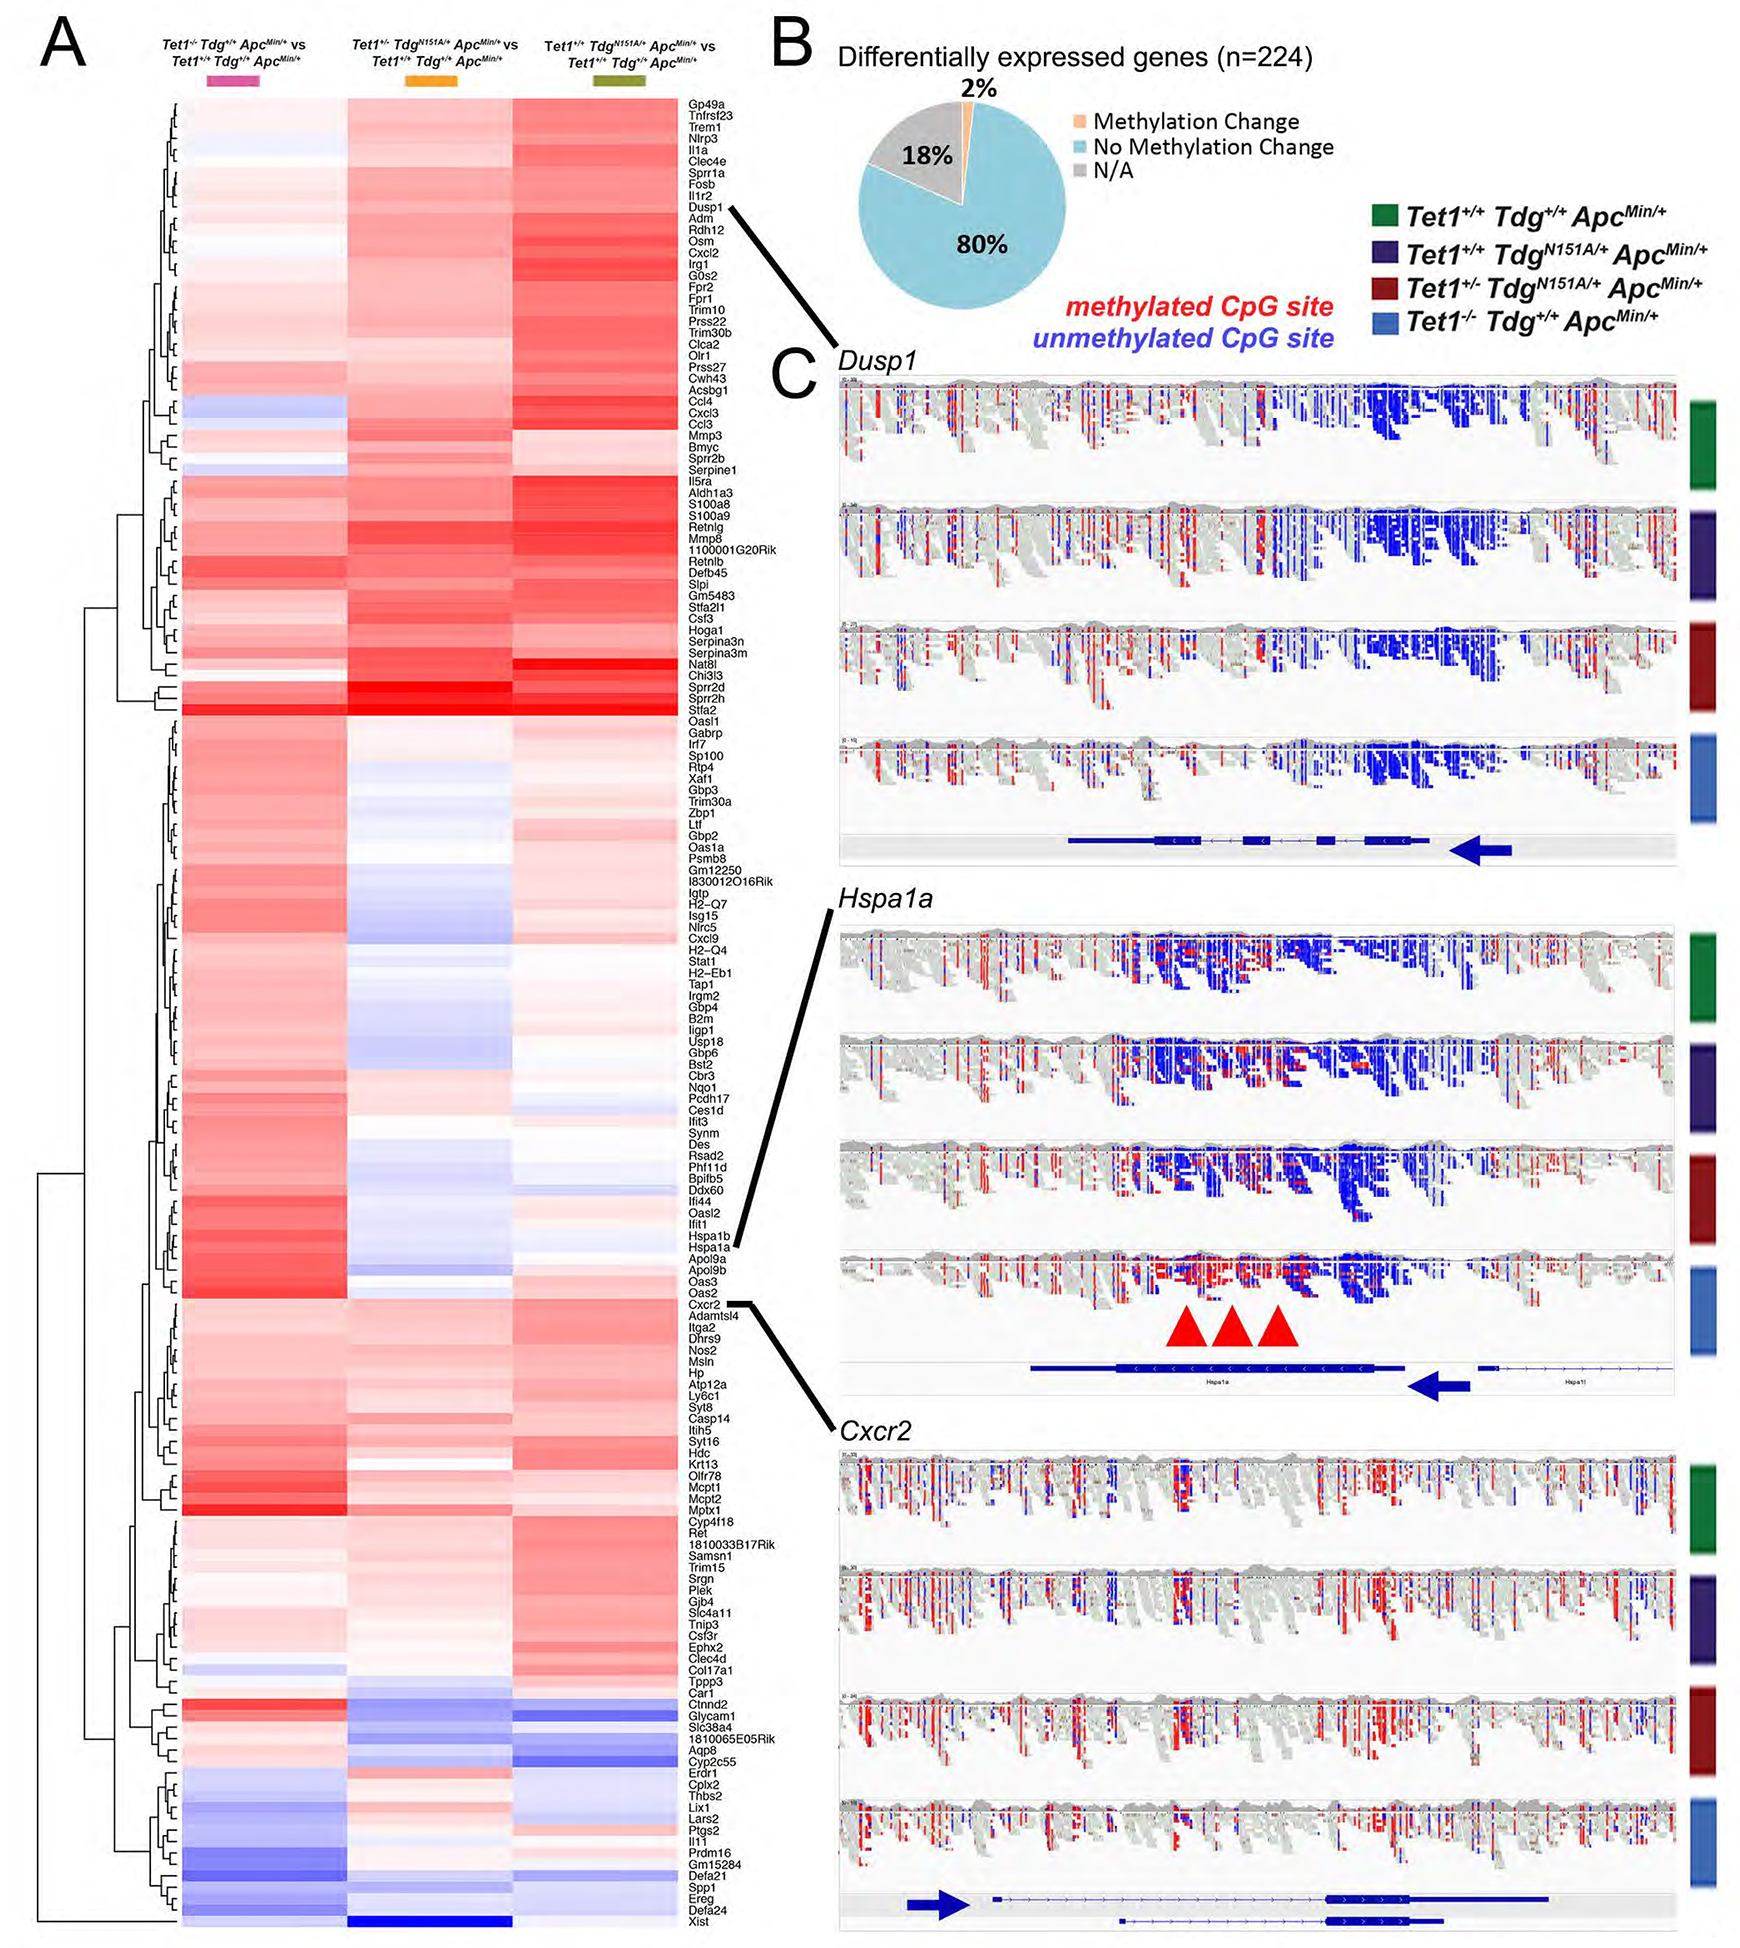
Figure 5 -. Tet1/Tdg-related inflammatory signature and methylation changes in differentially expressed genes.

(A) Hierarchical clustering of 160 genes differentially expressed between Tet1−/−Tdg+/+ApcMin/+ adenomas, Tet1+/−TdgN151A/+ApcMin/+ adenomas, Tet1+/+TdgN151A/+ApcMin/+ adenomas vs. control Tet1+/+Tdg+/+ApcMin/+ adenomas. (B) Summary of changes in methylation of differentially expressed genes in comparisons between Tet1−/−Tdg+/+ApcMin/+ adenomas, Tet1+/−TdgN151A/+ApcMin/+ adenomas, Tet1+/+TdgN151A/+ApcMin/+ adenomas vs. control Tet1+/+Tdg+/+ApcMin/+ adenomas. NA: for 18% of genes no methylation data were available in WGEM-seq dataset. (C) Genome browser views of WGEM-seq reads covering select differentially expressed genes. Blue: unmethylated CpG site; red: methylated CpG site. Blue arrows indicate direction of transcription. Red arrowheads mark gene body methylation of Hspa1a.
