
Figure 5.
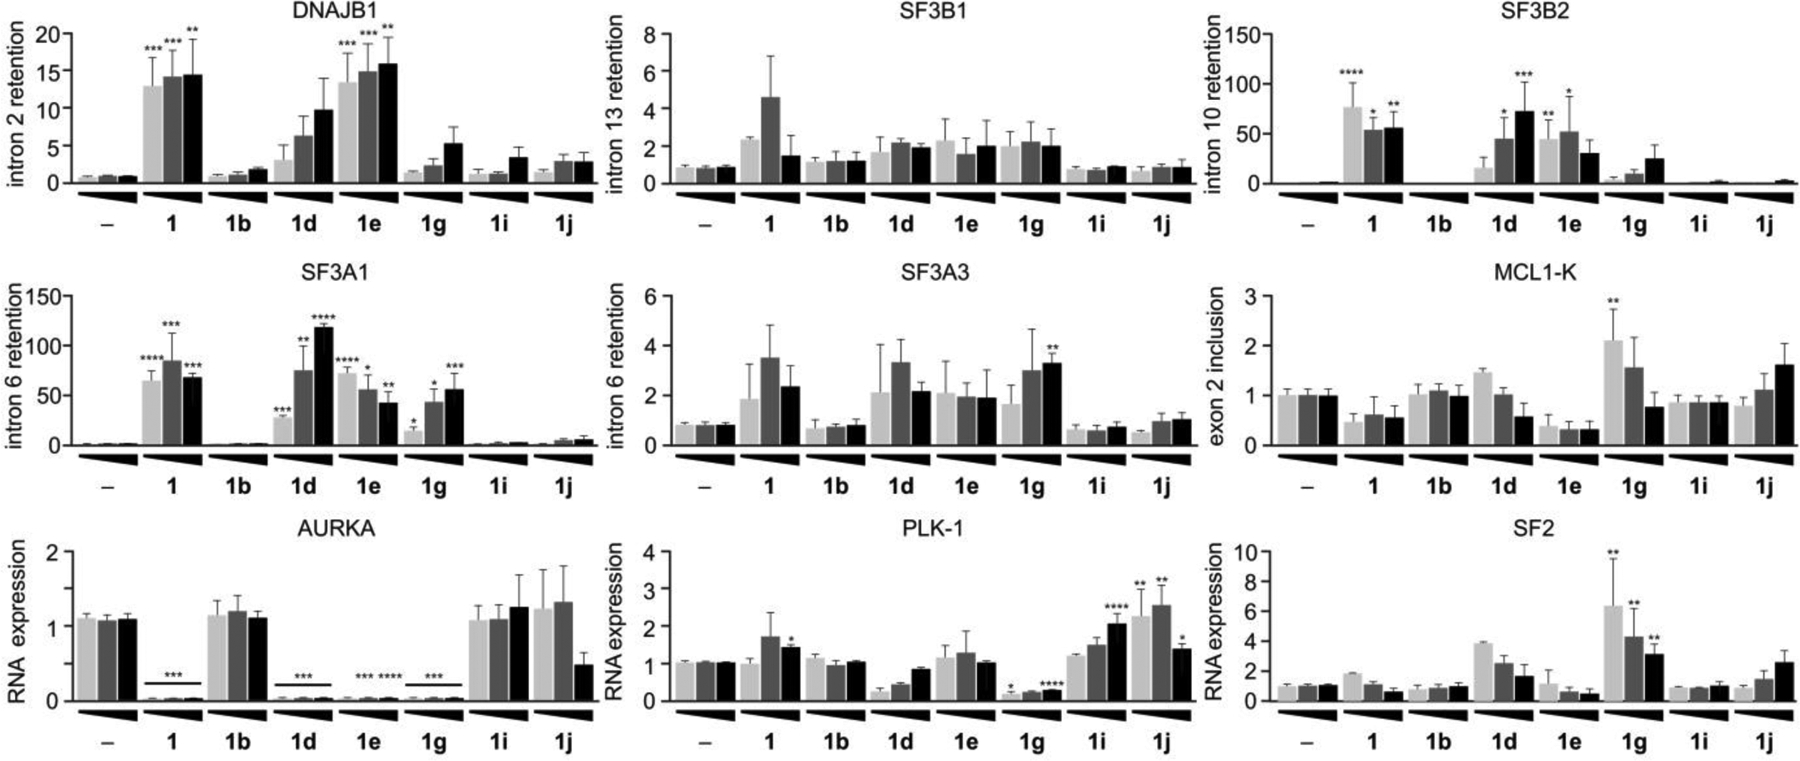
Structure-splicing profiles for RNA splice modulation after 24 h treatment. HCT116 tumor cells were treated with analogues at 100 nM (light grey), 250 nM (grey), or 500 nM (black) for 24 h, and then cellular RNA was isolated, purified and analyzed by qRT-PCR. Primers were designed to evaluate intron retention or exon skipping, direct responses to splice modulator treatment. The same genes are evaluated in this study as that at 4 h in Fig. 4. (–) denotes untreated cells. Numerical values represent the relative levels of intron retention with respect to negative control (–) at 1.