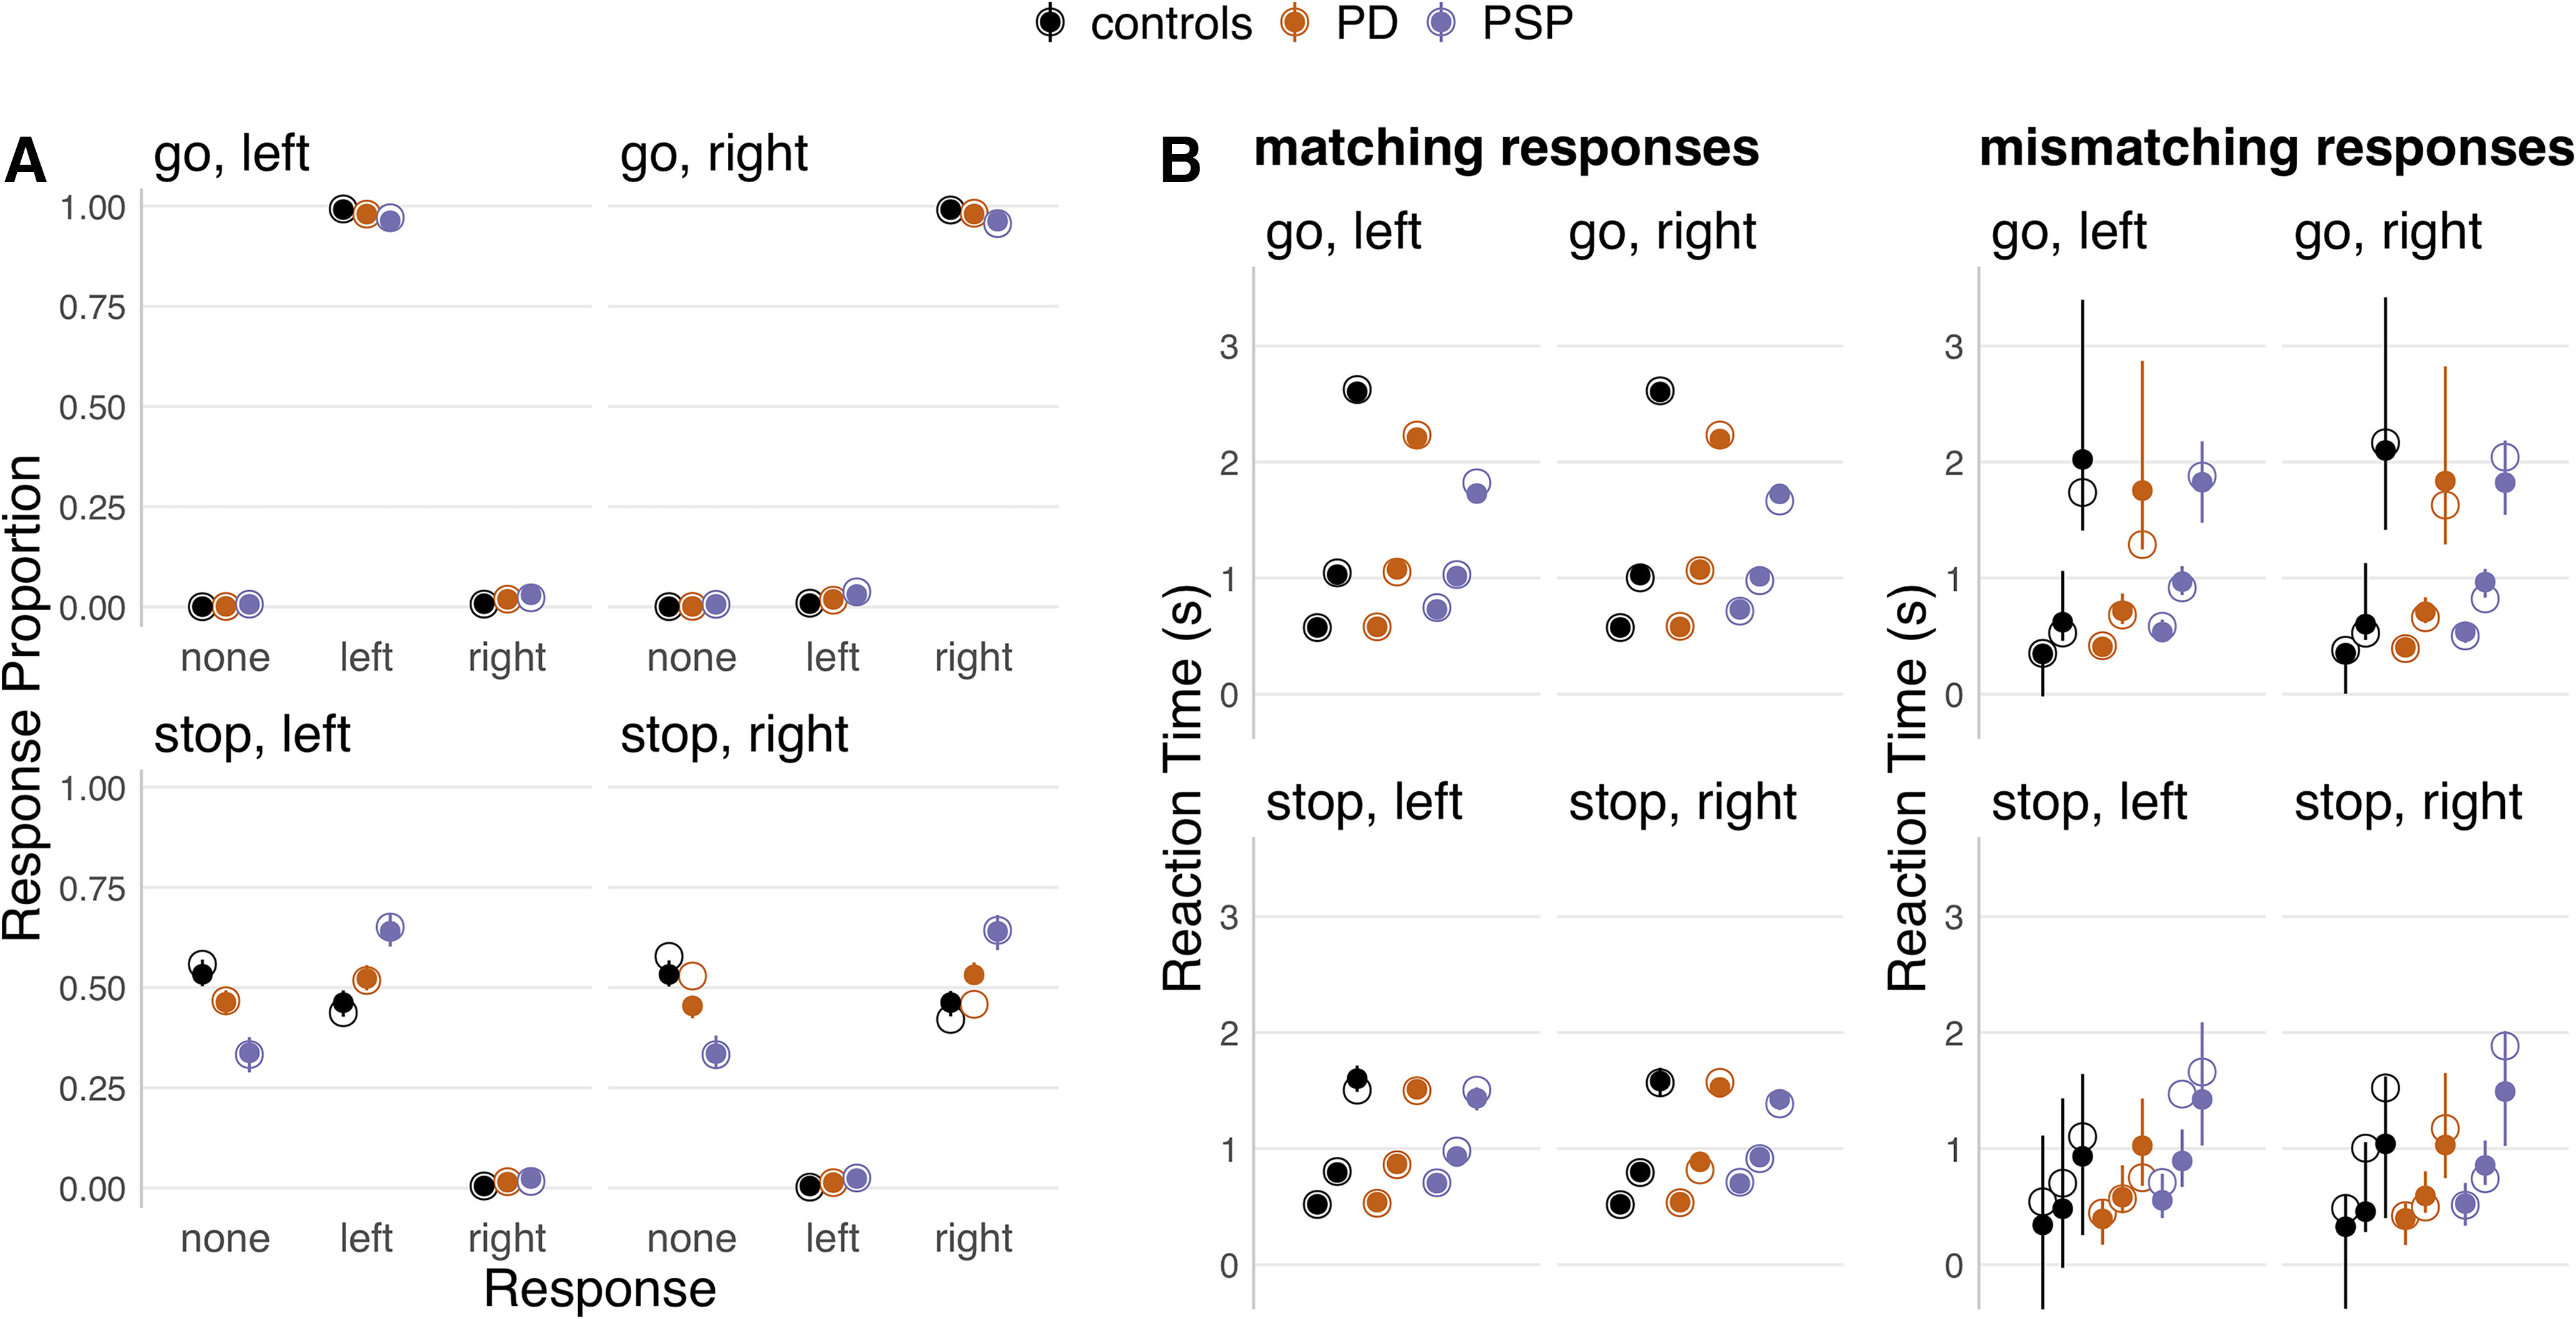
Figure 2.

Posterior predictive checks of response proportions and RTs. For each panel, the observed data (hollow dots) are compared with data from 100 simulated participants, drawn randomly from the posterior predictive distribution of the final model fit (solid dots and error bars). Each panel represents one unique combination of trial type (go vs stop) and choice stimulus (left vs right). The results are plotted separately for each group (controls, PD, PSP). For response proportions (A), the results are additionally plotted separately for each response option along the x axis (no response, left, right). For RTs (B), the 10th, 50th, and 90th percentiles of the RT distributions (bottom, middle, top dot) are plotted separately for response accuracy (matching vs mismatching), since mismatching responses constituted a very small proportion of the data. For each panel, the dots represent group-level medians, and the error bars indicate the group-level 95% QIs of the simulated data.
