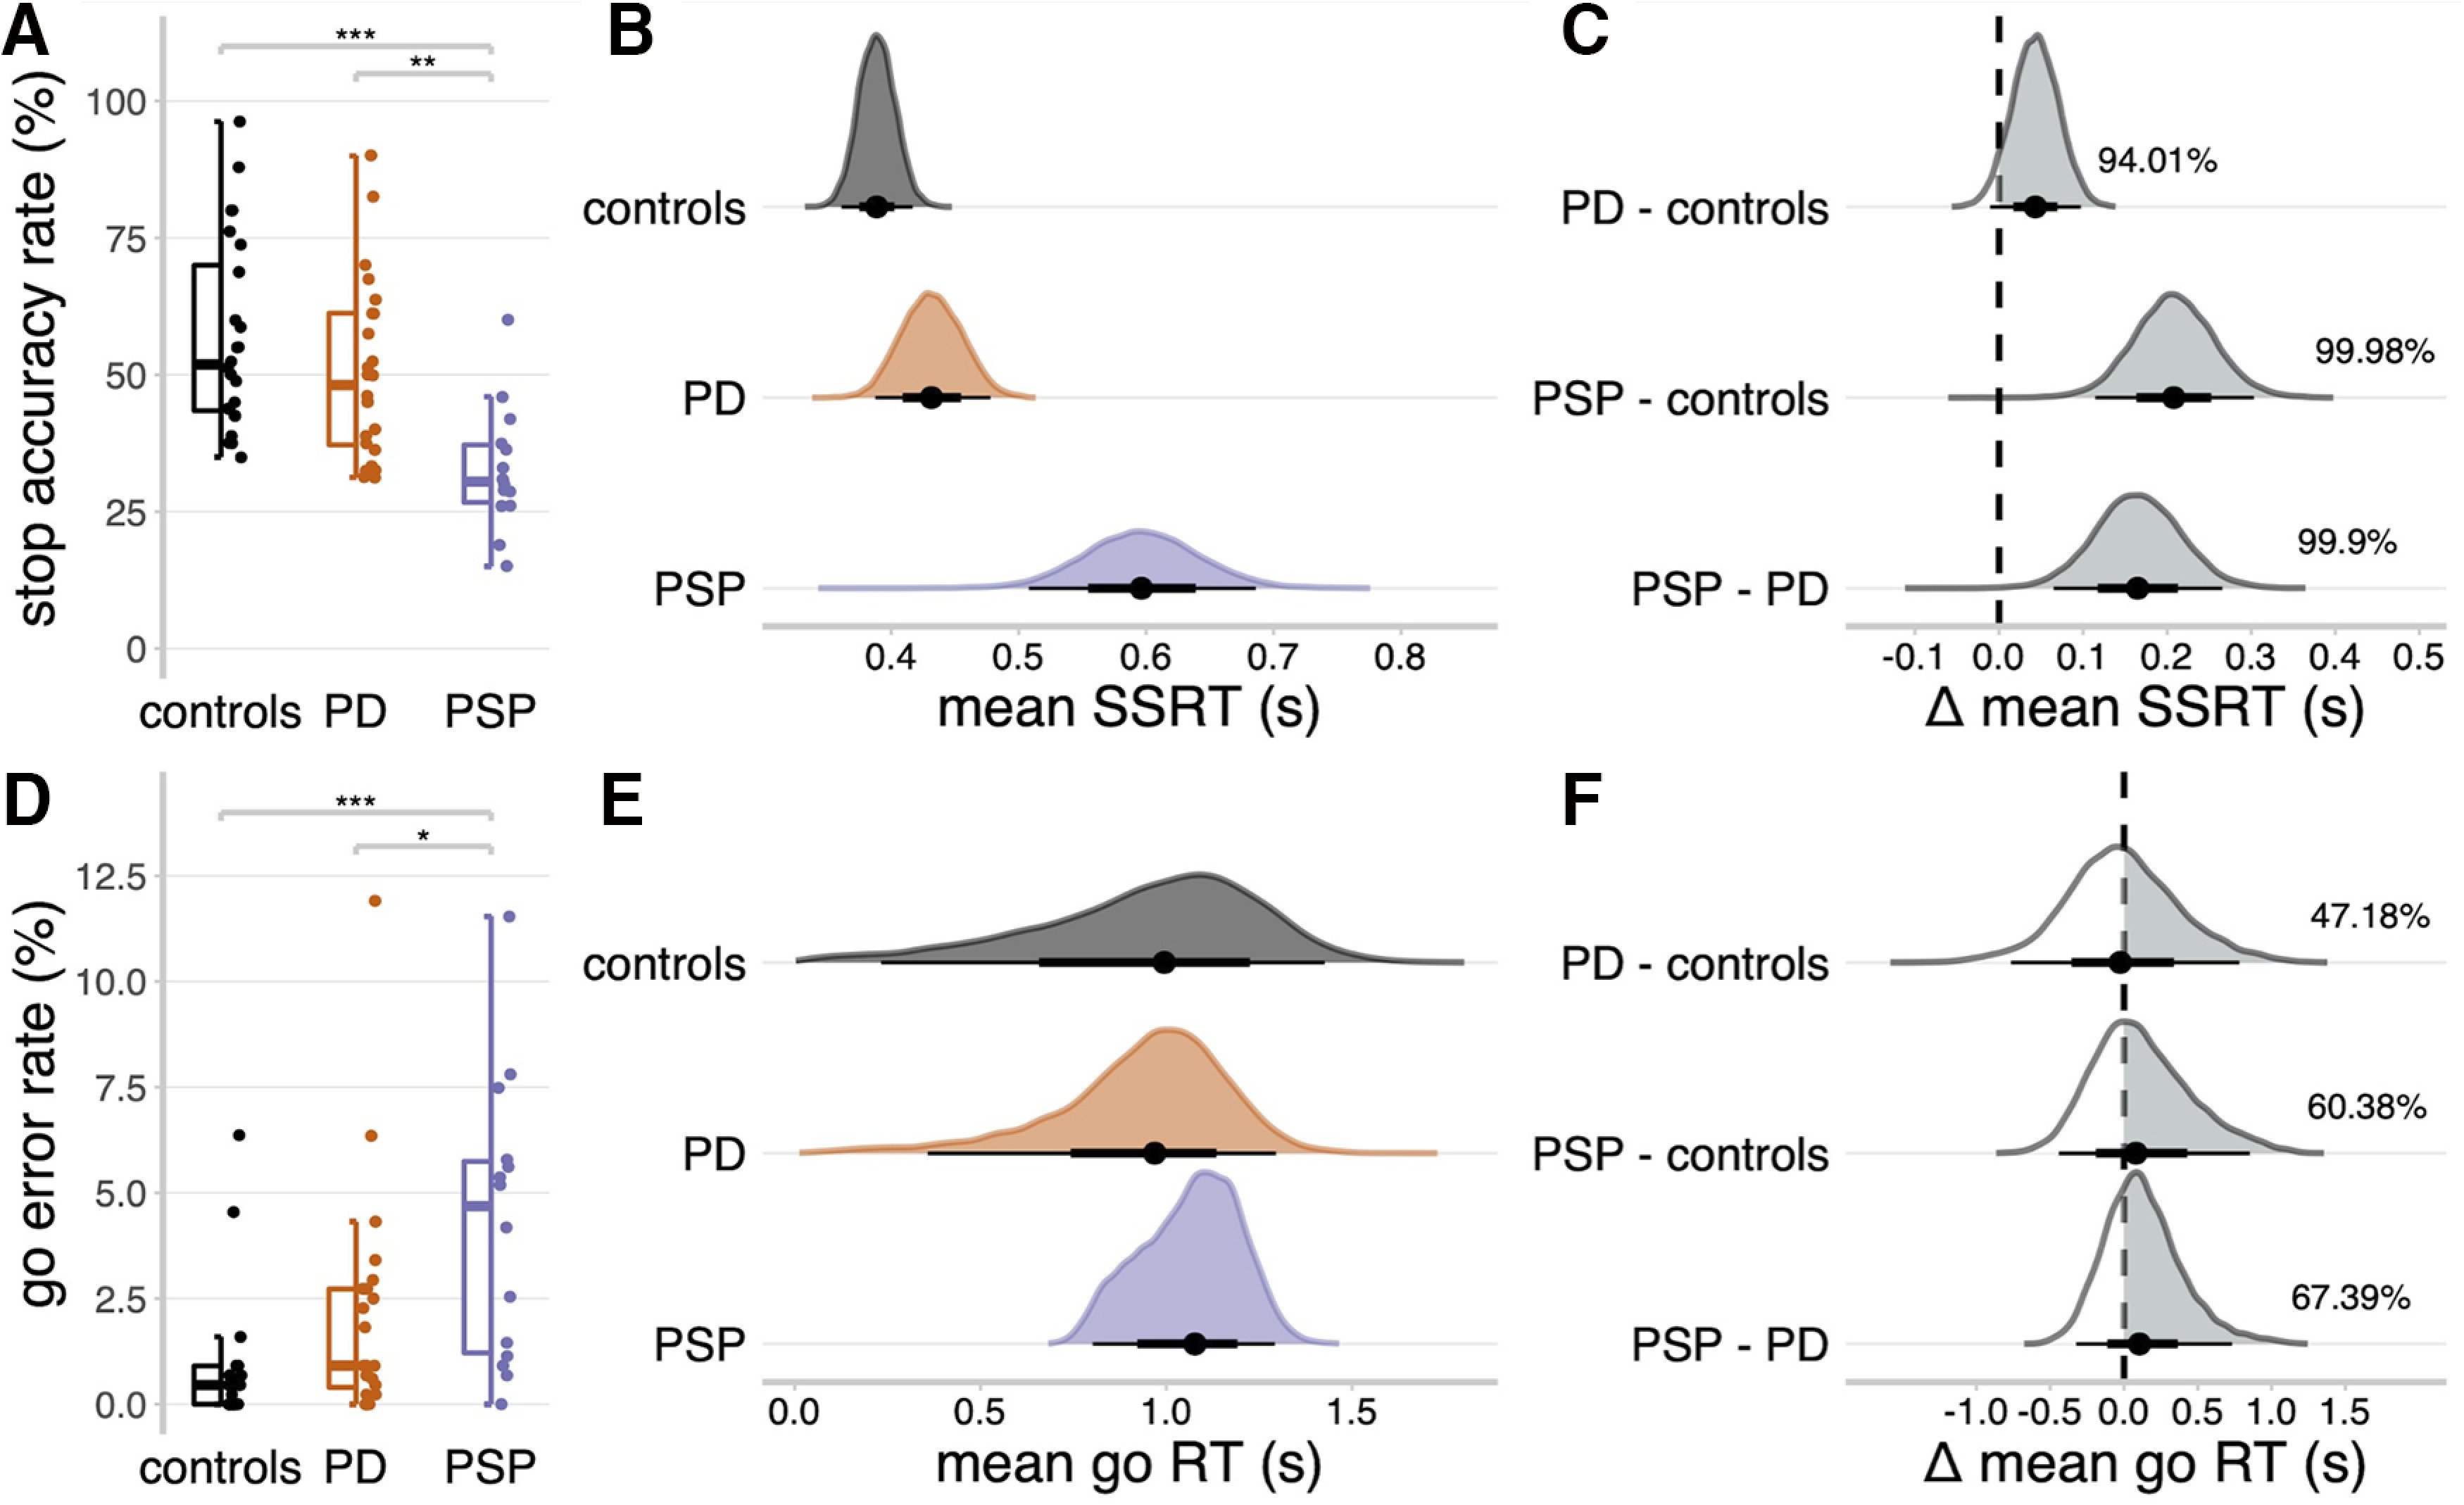
Figure 3.

Stop signal task performance. A, D, Proportions of successful stop trials (A) and incorrect go responses (D). Statistical significance of comparing groups: ***p < 0.001; **p < 0.01; *p < 0.005; post hoc Tukey's tests. B, E, Posterior distributions of the mean SSRTs (B) and mean go RTs (E). Black dots represent the medians. Thick black line segments indicate the 66% QIs. Thin black line segments indicate the 95% QIs. C, F, Posterior distributions of group comparisons for the mean SSRT (C) and mean go RT (F). Percentages indicate the proportion of the posterior distribution that is strictly positive (i.e., the gray shaded area).
