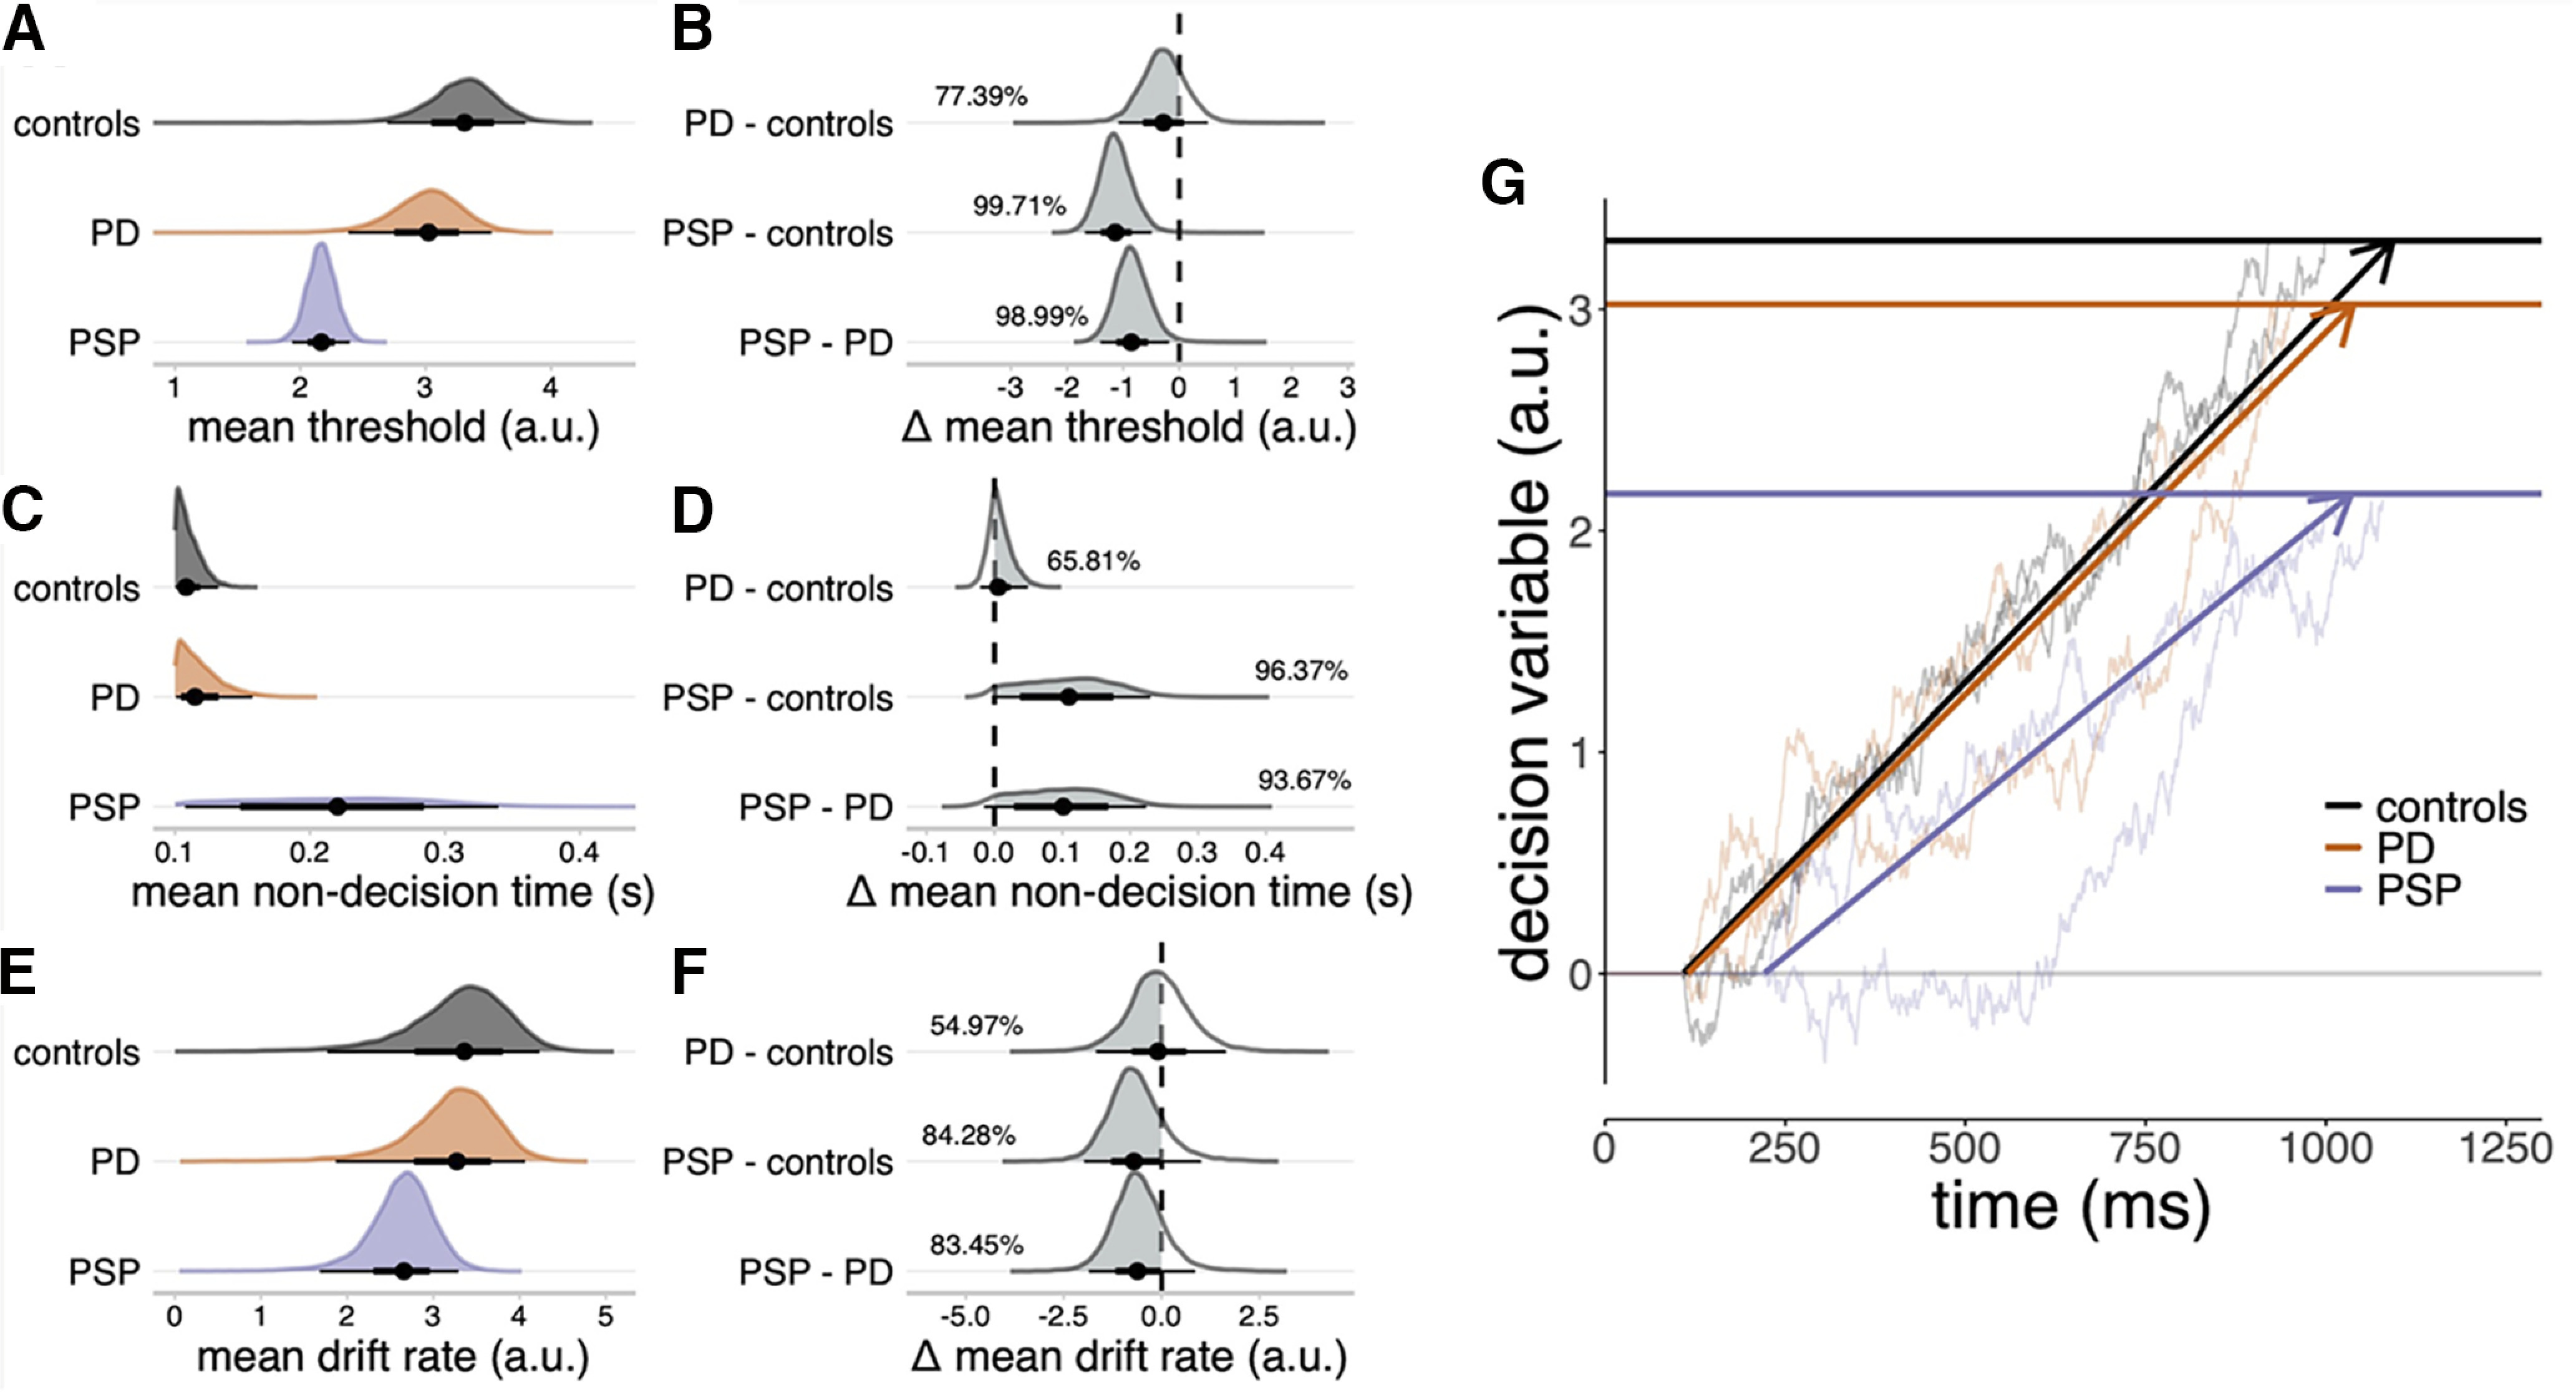
Figure 4.

Sequential sampling model of go responses. A, C, E, Posterior distributions of mean threshold (A), mean nondecision time (C), and mean drift rate (E). Black dots represent the medians. Thick black line segments indicate the 66% QIs. Thin black line segments indicate the 95% QIs. B, D, E, Posterior distributions of group comparisons for the mean threshold (B), mean nondecision time (D), and mean drift rate (F). Percentages indicate the proportion of the posterior that is strictly negative (B, F) or positive (D), that is, the gray shaded area. G, Schematic illustration of the sequential sampling model. Evidence for a go response accumulates stochastically at a constant average rate (the drift rate) until a threshold is reached. To explain RTs, the time taken by the accumulator to reach the threshold is offset by a constant nondecision time. Bold horizontal lines indicate the posterior median estimates of the mean thresholds. Bold directed lines indicate the posterior median estimates of the mean drift rate. Thin lines provide examples of simulated random walks.
