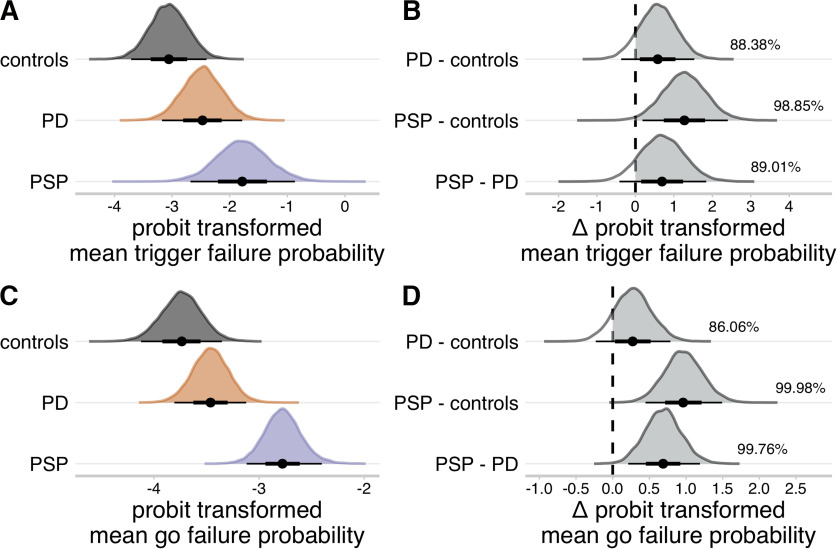
Figure 5.
Group-level means of attentional failure parameters. A, C, Posterior distributions of probit transformed mean trigger failure probability (A), and probit transformed mean go failure probability (C). Black dots represent the medians. Thick black line segments indicate the 66% QIs. Thin black line segments indicate the 95% QIs. B, D, Posterior distributions of group comparisons for the probit transformed mean trigger failure probability (B) and probit transformed mean go failure probability (D). Percentages indicate the proportion of the posterior that is strictly positive (i.e., the gray shaded area). The probit function was used to project the attentional failure parameters from the probability scale (0, 1) to the real line (−∞, ∞).

