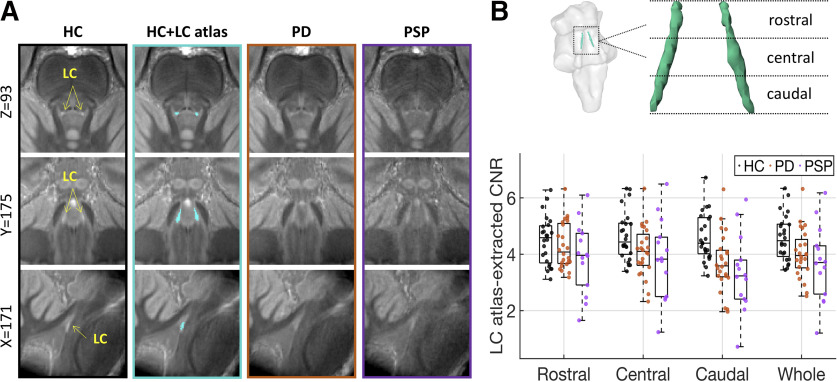
Figure 6.
The difference of LC structural integrity in healthy controls and patients. The group averages of the coregistered LC scans were presented (A) where PD and PSP patients had diminished contrast in the LC area comparing to the healthy control. The fit of the 25% LC atlas (second column, cyan area) to LC scans was also presented. The averaged contrast to noise ratios of the LC were presented (B) for the whole LC and three subregions (rostral, central, and caudal) for individual healthy controls (black dots), PD (orange dots), and PSP patients (purple dots). The group difference was most evident in the caudal LC. Error bars indicate SEs.

