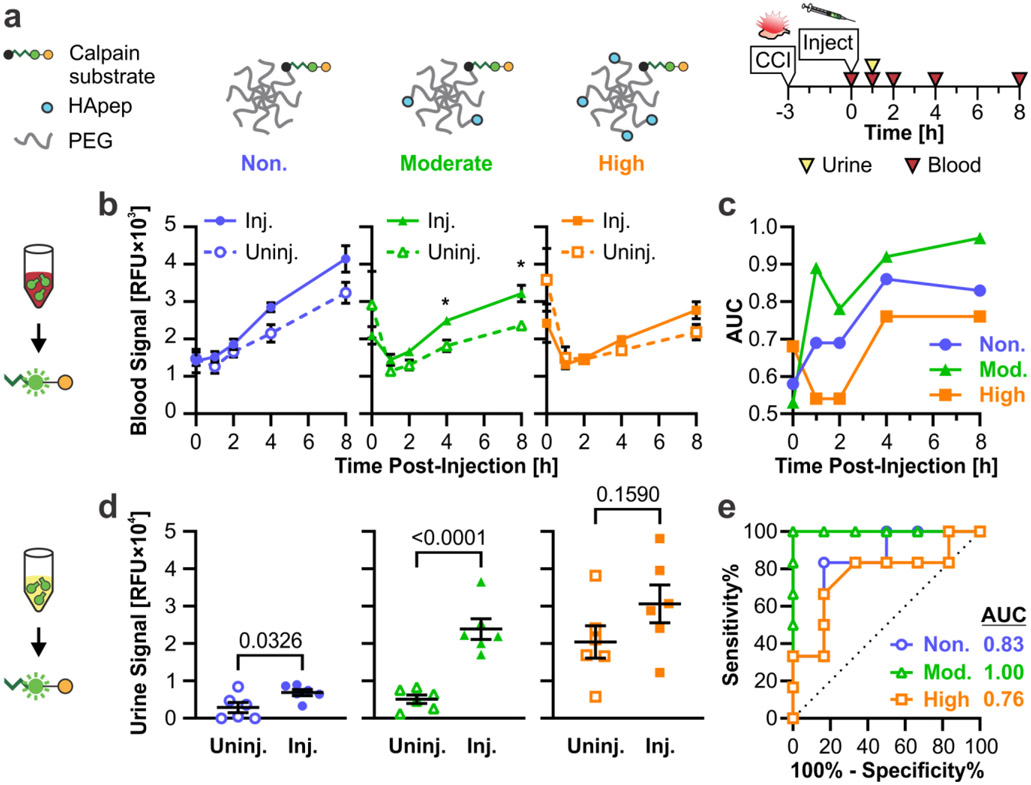
Figure 4. Targeting to hyaluronic acid improves the sensitivity of TBI-ABN in both blood and urine.
a. Schematic of HA-targeted TBI-ABNs with non-, moderate, and high targeted ABNs. b. Activation of sensor in the blood of injured and uninjured mice at multiple time-points post-injection as measured by fluorescence (n = 6 per group, mean ± SE, Two-way RM ANOVA with Geisser-Greenhouse correction and Sidak’s multiple comparisons post-hoc test for each time point, *p<0.05). c. AUCs for blood ROCs taken at each time point (n = 6 per group). d. Accumulation of activated sensor in the urine of mice 1 h post-injection as measured by fluorescence (n = 6 per group, mean ± SE, Unpaired t-test). e. ROC curves and calculated AUCs from fluorescence measurements of urine (n = 6 per group). See Table S1 for additional ROC statistics.

